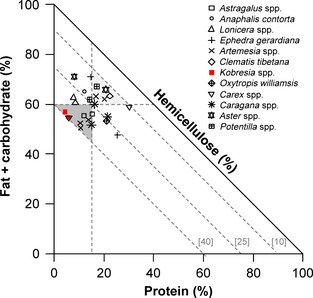
Figure 4.

Right‐angled mixture triangle (Raubenheimer 2011) showing the balance of protein and nonprotein (fat + carbohydrate) macronutrients to digestible fiber (hemicellulose) of plants consumed by blue sheep (Pseudois nayaur) as a percentage of the sum of each (protein + nonprotein macronutrients + hemicellulose) on a dry matter basis. Hemicellulose is shown on the implicit z‐axis which is inversely related to the distance from the origin. Dashed gray lines indicating 40%, 25%, and 10% hemicellulose balance, as well as lines indicating 60% nonprotein macronutrient and 15% protein, are shown for reference. Light gray shading indicates plants that have higher macronutrient and lower hemicellulose balance, while dark gray shading indicated plants that have higher hemicellulose and lower macronutrient balance. The plants found most frequently in the blue sheep diet (Kobresia spp.) are shown as red squares.
