Figure 6.

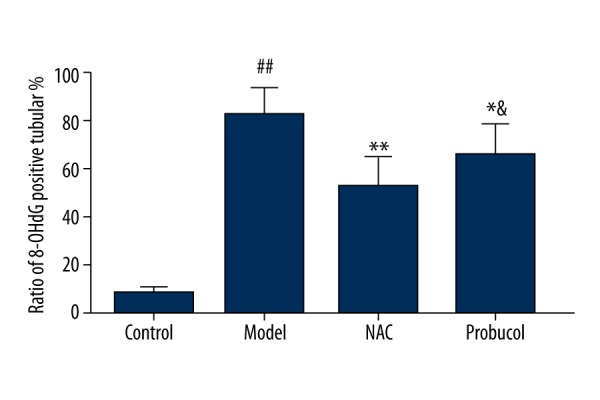
Ratio of 8-OHdG positive tubular with immunolocalization staining in rats after modeling. ## P<0.01, compared with the control group; * P<0.05, ** P<0.01, compared with the model group; & P<0.05, compared with the NAC group.

Ratio of 8-OHdG positive tubular with immunolocalization staining in rats after modeling. ## P<0.01, compared with the control group; * P<0.05, ** P<0.01, compared with the model group; & P<0.05, compared with the NAC group.