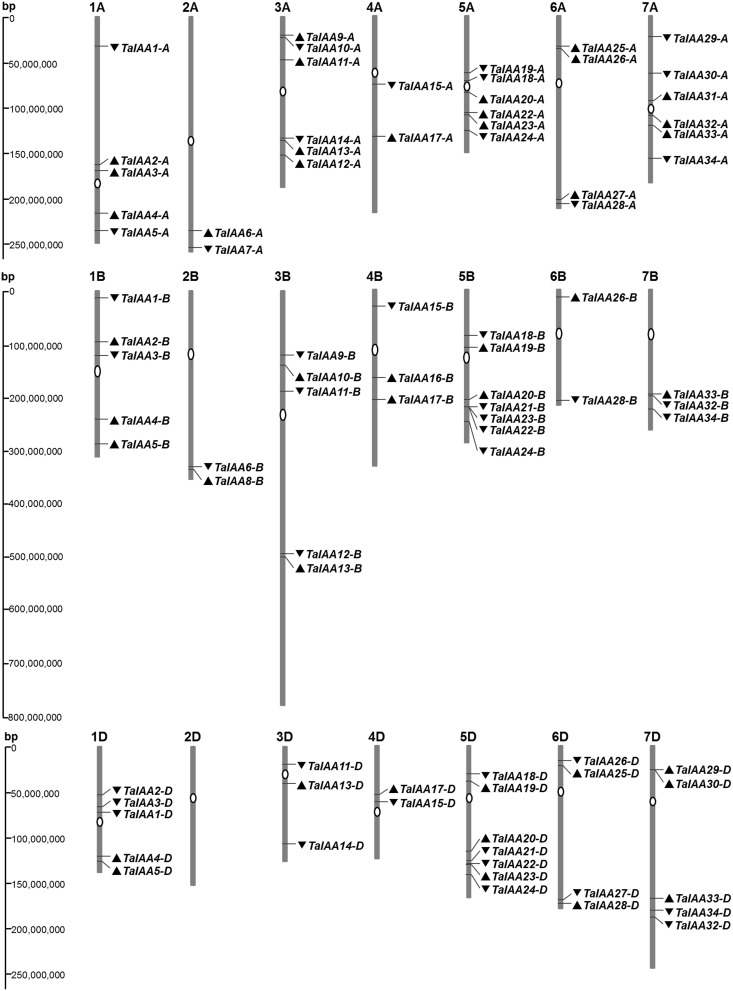
Figure 2.
Chromosome distribution of TaIAA family in wheat. White ovals on the chromosomes (vertical bar) indicate the position of centromeres. The arrows next to gene names show the direction of transcription. The position of each gene can be estimated using the left scale. The chromosome numbers are indicated at the top of each bar.

