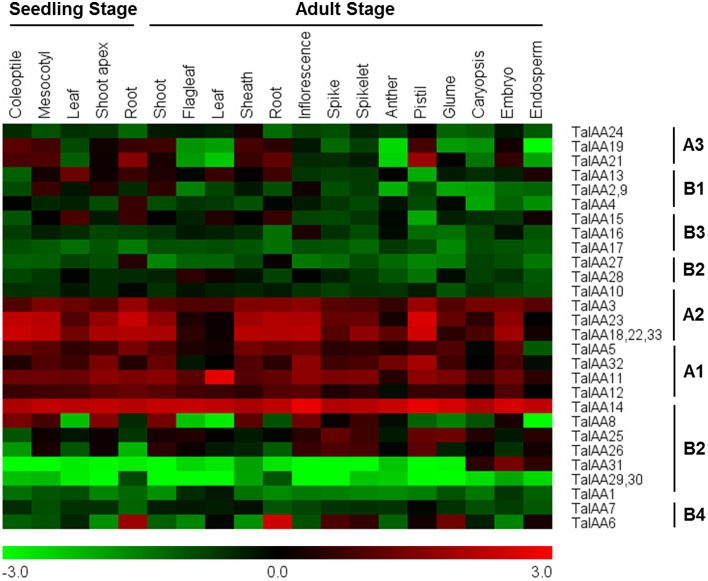
Figure 6.
Heatmap of expression profiles for TaIAA genes across different organs of seedling and adult stages. The expression data were generated from GeneVestigator database and viewed in MeV software. The relative expression level of a particular gene in each row was normalized against the mean value by log2 transformation. The color scale below represents expression values, green indicating low levels and red indicating high levels of transcript abundance.

