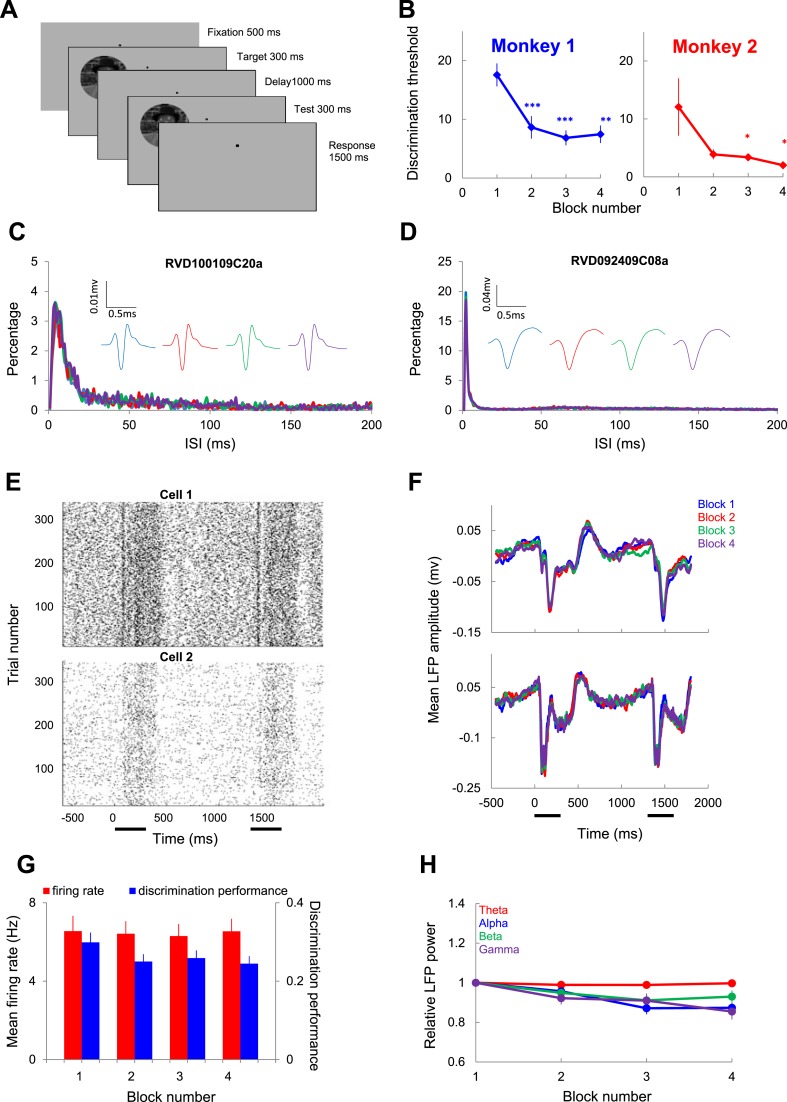
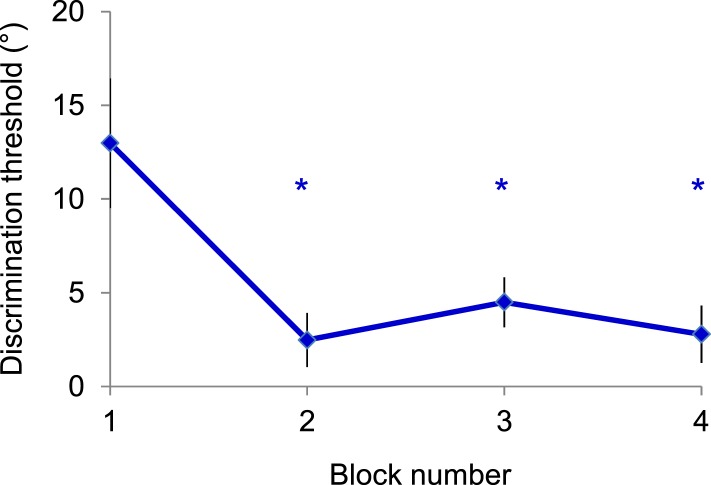
Figure 1. Individual neuron and LFP responses in area V4 during rapid learning.
(A) Schematic description of the rapid learning protocol. After 500 ms of fixation, a target image was presented for 300 ms, followed, after a 1000-ms blank, by a 300-ms test image (monkeys maintained fixation within a 1 × 1 deg window). Monkeys were required to hold a lever for 1500 ms if the test image was rotated relative to the target, and release it within 500 ms if the target and test were identical. (B) Changes in mean behavioral discrimination threshold binned in 96-trial blocks for monkeys 1 and 2. Error bars represent s.e.m. (C, D) Two example inter-spike interval (ISI) distributions for each block in two single units. Insets show average spike waveforms in each block. (E) Raster plots represent the spike timing of two V4 neurons recorded throughout the time course of learning. (F) Examples of local field potential (LFP) responses at two recording sites. Each curve represents the average response across all trials and test orientations within the same block. The horizontal bars mark the 300-ms time windows during which the target and test stimuli were presented. (G) Mean single unit firing rates and discrimination performance (d') across blocks of learning. The error bars represent SEM. (H) Mean relative LFP power in the theta, alpha, beta, and gamma bands in different blocks. The LFP power of individual channel in each block across all test orientation was normalized by the mean in the first block; the mean population LFP power was calculated by averaging across all channels. LFP power in different frequency bands was scaled differently since recordings from different sites depended on electrode impedance.


