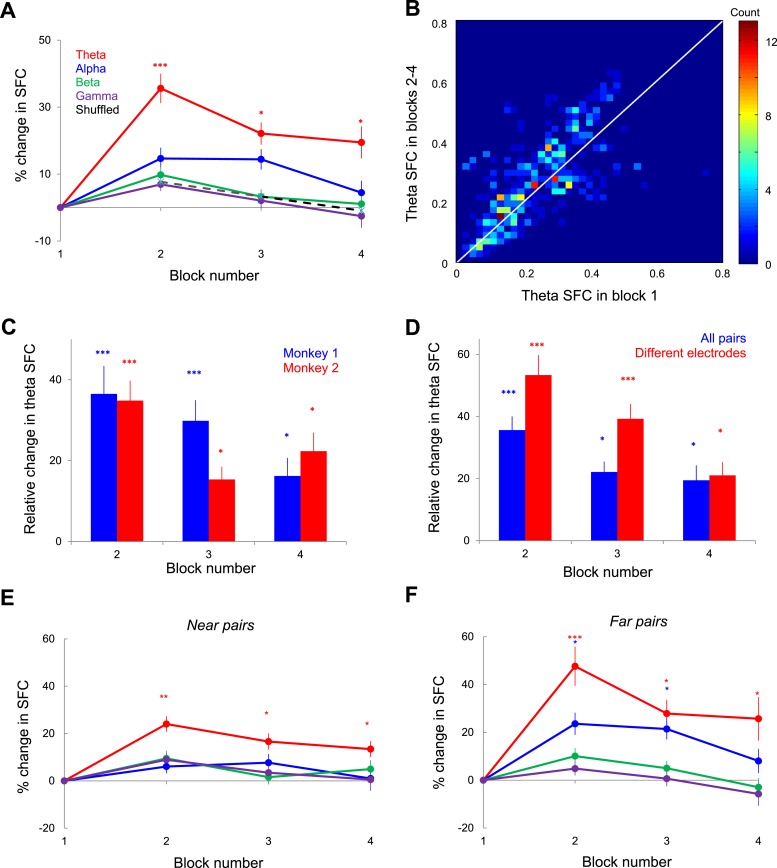
Figure 3. Changes in spike-LFP coherence during learning.
(A) Relative change of mean SFC in each block and frequency band. The error bars represent s.e.m. across spike-LFP pairs. Asterisks for each point show the statistical significance of the difference between SFC in each of blocks 2, 3, and 4 relative to block 1 in each frequency band. (B) Distribution of mean theta SFC values in blocks 2–4 vs block 1. Color indicates the number of spike-LFP pairs measured in blocks 2–4 vs block 1 in 0.02 bins. (C) Block-by-block change in theta SFC relative to block 1 for each monkey. Error bars represent s.e.m. (* represents p < 0.05; *** represents p < 0.001). (D) Relative change in theta SFC when the pairs originating from the same electrode are included (blue, all pairs) or excluded (red, different electrodes). The error bars represent s.e.m. (E) Near pairs (electrode distance <2 mm): Kruskal–Wallis test showed no significant changes induced by learning in alpha, beta, and gamma bands (p = 0.09, 0.19, and 0.12, respectively), but a significant increase in theta band (p = 2.29 10−5). (F) Far pairs (electrode distance >2 mm): Kruskal–Wallis test showed no significant changes in alpha, beta, and gamma bands (p = 0.58, 0.10, and 0.13 respectively), but a significant increase in theta band (p = 1.73 10−6).

