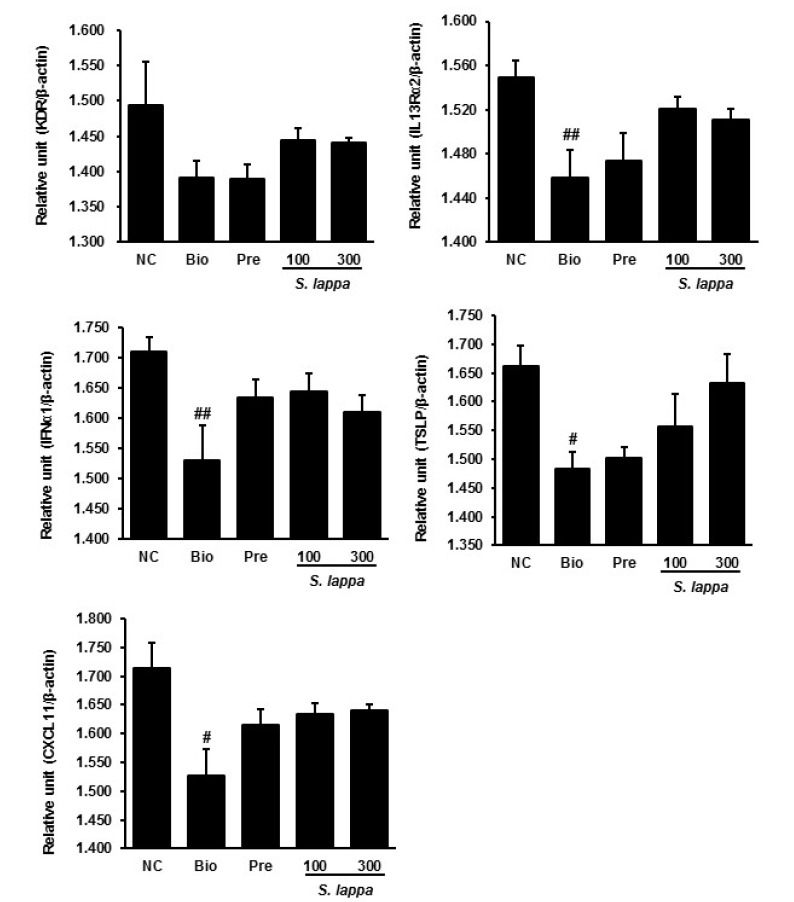
Fig. 2.

Validation of selected up-regulated genes using real-time qPCR in skin tissue from Nc/Nga mice. The results are normalized as a ratio of each specific mRNA signal (KDR, IL13Rα2, IFNα1, TSLP, and CXCL11) to the β-actin gene signal within the same sample and the values expressed. Data are presented as mean ± SD (n = 3). #p < 0.05 and ##p < 0.01 vs. normal control.
