Figure 4.
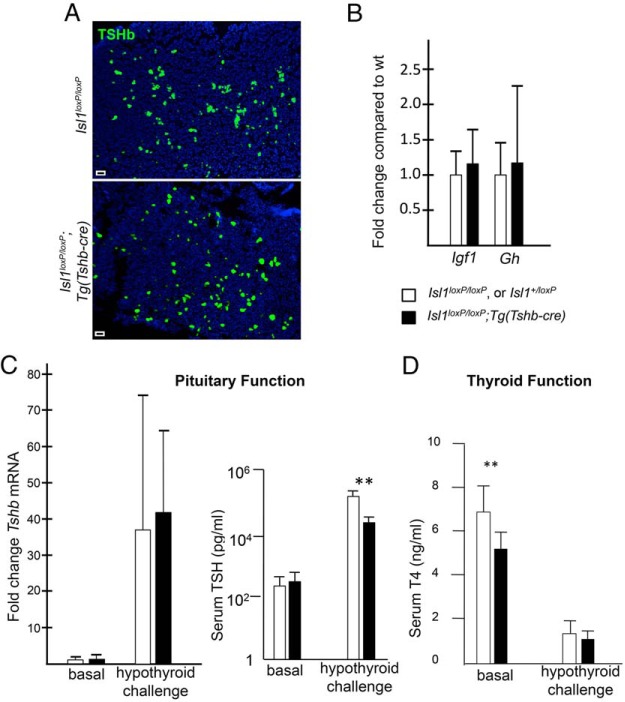
Blunted TSH response to hypothyroidism in Isl1loxP/loxP;Tg(Tshb-cre) mice. A, There is no obvious difference in TSHβ staining in Isl1loxP/loxP;Tg(Tshb-cre) pituitary glands at 8 weeks. TSHβ staining was performed on 5 pituitary sections at regular intervals for each transgenic and control mouse (n = 3/genotype). Photos were taken at ×100. Scale bar, 100 μm. B, qPCR was used to determine the mRNA expression fold change in liver Igf1 and pituitary Gh of Isl1loxP/loxP;Tg(Tshb-cre) relative to controls. C, qPCR was used to determine the fold change in pituitary Tshb mRNA expression in Isl1loxP/loxP;Tg(Tshb-cre) mice compared with controls in both basal and hypothyroid challenge conditions. Serum levels of TSH were measured in Isl1loxP/loxP;Tg(Tshb-cre) and control females under basal and hypothyroid conditions. There was no significant difference in basal levels between Isl1loxP/loxP;Tg(Tshb-cre) mice (297 ± 99 pg/mL, n = 6) and the controls (234 ± 114 pg/mL, n = 12), respectively. After hypothyroidism challenge, the transgenics responded with less dramatic elevation in TSH relative to controls: 27 × 103 ± 13 × 103 pg/mL, n = 4 vs 165 × 103 ± 94 × 103 pg/mL, n = 10. Note the logarithmic scale. **, P < .01. D, Total serum T4 levels were measured in Isl1loxP/loxP;Tg(Tshb-cre) and control male mice under basal and hypothyroid conditions. Under basal conditions, T4 levels were significantly different (6.7 ± 1.3 ng/mL, n = 14, vs 5.1 ± 0.93 ng/mL, n = 7; *, P < .05). After hypothyroid challenge, the total T4 levels in serum were reduced compared with basal levels (1.4 ± 0.57 ng/mL, n = 10, and 1.1 ± 0.29 ng/mL, n = 5).

