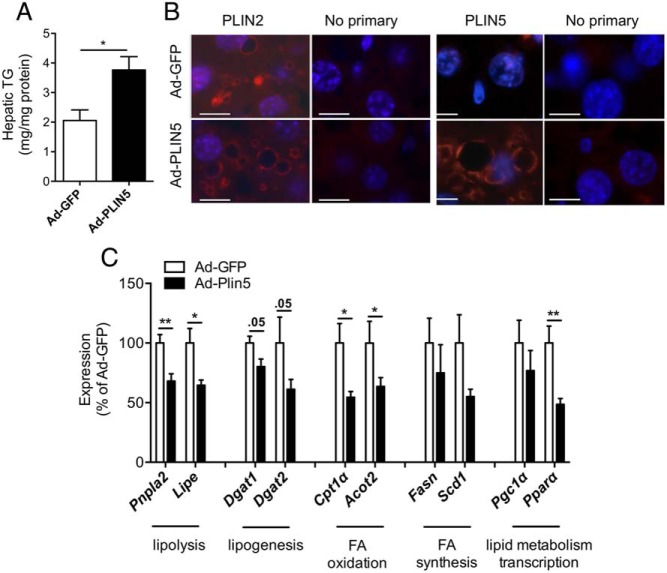
Figure 2.
Change in lipids and LD in HFD mice treated with Ad-PLIN5. A, Hepatic TG quantitated in livers of Ad-GFP- and Ad-PLIN5-treated mice after 6 week of HFD. Data are mean ± SEM; n = 5–6 per group; *, P < .05. B, Liver sections from Ad-GFP (top row)- and Ad-PLIN5 (bottom row)-treated mice immunostained with PLIN2 and immunostained with PLIN5 along with negative control (no primary antibodies). Scale bar, 10 μm. C, Quantitative PCR determined the expression of genes involved in major lipid metabolic pathways in livers of Ad-PLIN5 male mice on HFD for 6 weeks. Levels are presented taking the levels of Ad-GFP on the corresponding duration of HFD as 100%. Expression levels were normalized using β-actin as an internal control. Data are mean ± SEM; n = 5–6; *, P < .05; **, P < .01. Pnpla2, ATGL; Lipe, hormone-sensitive lipase (aka HSL); Dgat1 and Dgat2, DG acyltransferases 1 and 2; Cpt1a, carnitine palmitoyltransferase 1α; Fasn, FA synthase; Scd1, stearoyl-CoA desaturase-1; Acot2, acyl-CoA thioesterase 2; Ppargc1a, PPAR-γ coactivator 1α.

