Figure 6.
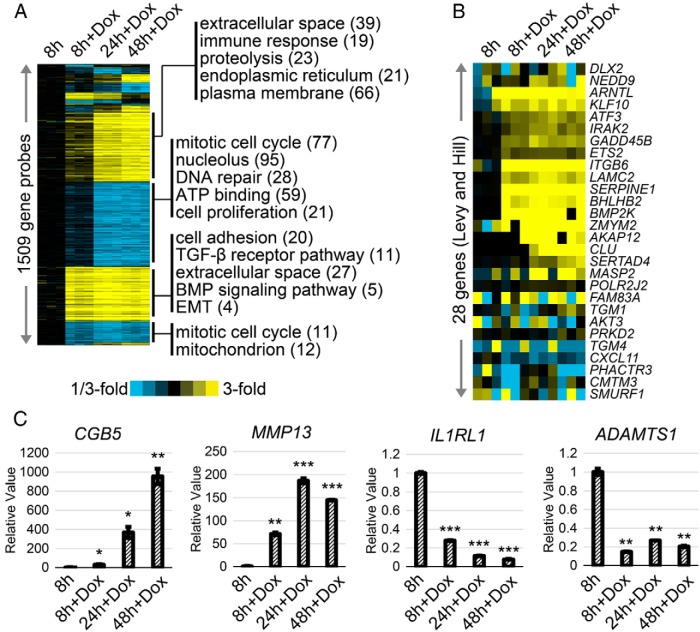
Gene expression profiling of PDAC cell line BxPC3 after forced SMAD4 expression. A, Gene expression profiles of BxPC3-pINS4c5 cells were taken at 8, 24, and 48 hours after addition of 1-μg/mL doxycycline. Differentially expressed genes (P < .01, fold change > 2) were identified at each time point relative to untreated control. Genes were sorted according to time of induction or repression. Selected gene classes (by Gene Ontology) are indicated for genes regulated at 8 or 24 hours. B, For a set of 28 genes previously found induced in a SMAD4-dependent manner in a different model system (7), the corresponding patterns are shown for our BxPC3-pINS4c5 system. C, RT-qPCR was performed using mRNA from BxPC3-pINS4c5 cells untreated or treated with 1-μg/mL doxycycline for 8, 24, or 48 hours to validate gene expression changes observed in the microarray analysis. Patterns of expression change for chorionic gonadotropin, β-polypeptide 5 (CGB5), matrix metallopeptidase 13 (MMP13), ADAM metallopeptidase with thrombospondin type 1 motif, 1 (ADAMTS1), and IL-1 receptor-like 1 (IL1RL1) closely match those observed via microarray. Comparisons are Student's 2-tailed paired t test with ***, P ≤ .001; **, P ≤ .005; *, P ≤ .05.

