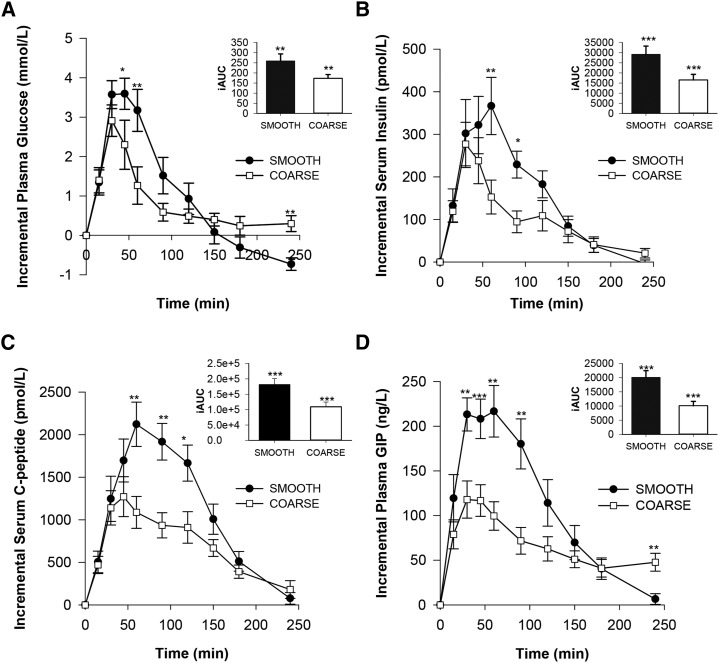
FIGURE 3 .
Postprandial changes in blood glucose (A), insulin (B), C-peptide (C), and GIP (D) concentrations after smooth and coarse porridge meals. Each meal provided 55.4 g of starch. Values are mean deviations from baseline ± SEMs (n = 9 for glucose, insulin, and C-peptide and n = 8 for GIP) and were analyzed by ANOVA with meal and time as factors. Meal, time, and meal × time were significant for glucose (P = 0.038, <0.001, and <0.001), insulin (P = 0.046, <0.001, and 0.035), C-peptide (P = 0.018, <0.001, and <0.001), and GIP (P = 0.024, <0.001, and <0.001) responses, respectively. Time points at which values differed significantly, *P < 0.05, **P < 0.01, and ***P < 0.001 (paired t test with Bonferroni corrections). Insets show the iAUC between 0 and 120 min. GIP, glucose-dependent insulinotropic polypeptide; iAUC, incremental AUC.

