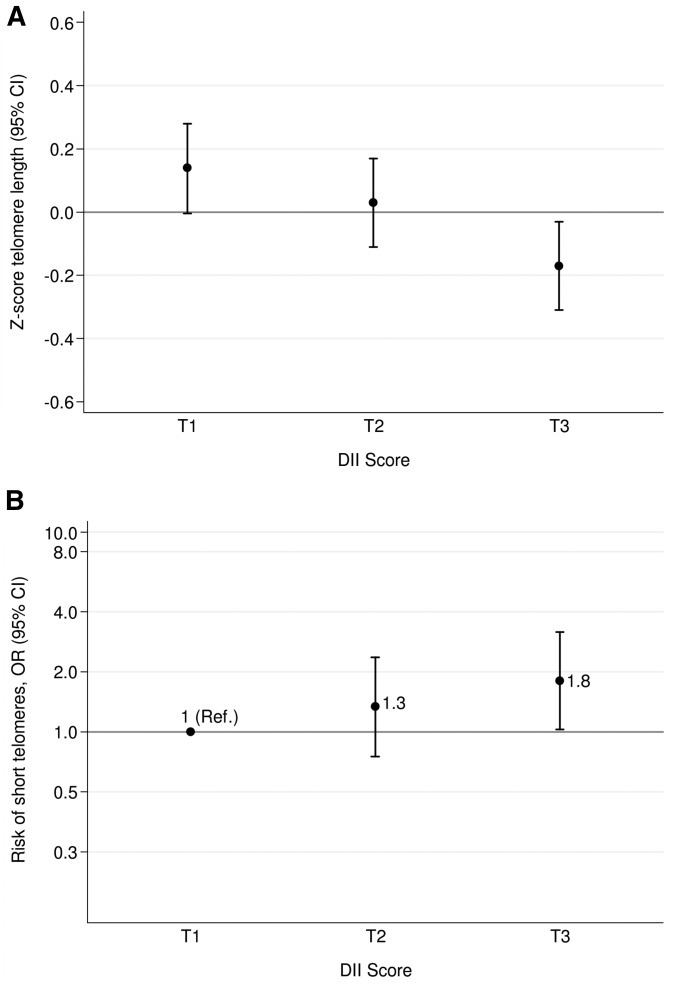
FIGURE 1.
Mean baseline telomere length z score (A) and risk of having short telomeres (B) by tertiles of DII. Adjustments were made for sex, BMI (in kg/m2), physical activity (metabolic equivalent tasks in min/d), smoking status (dichotomous), diabetes status (dichotomous), hypertensive status (dichotomous), dyslipidemia status (dichotomous), and group of intervention (3 categories). Error bars indicate 95% CIs. A z score ≤20th percentile indicates short telomeres. The y axis of panel B is log scale. Tertiles of DII are −4.87 to −1.57 (T1), −1.56 to −0.25 (T2), and −0.24 to ≥3.27 (T3) after adjustment for total energy intake (kcal/d) with use of the residual method. (A) ANCOVA test and linear trend test were fitted (P-ANCOVA = 0.01, P-trend = 0.01); (B) multivariable logistic regression and linear trend test were fitted (P-trend = 0.04). DII, Dietary Inflammatory Index; Ref, reference; T, tertile.

