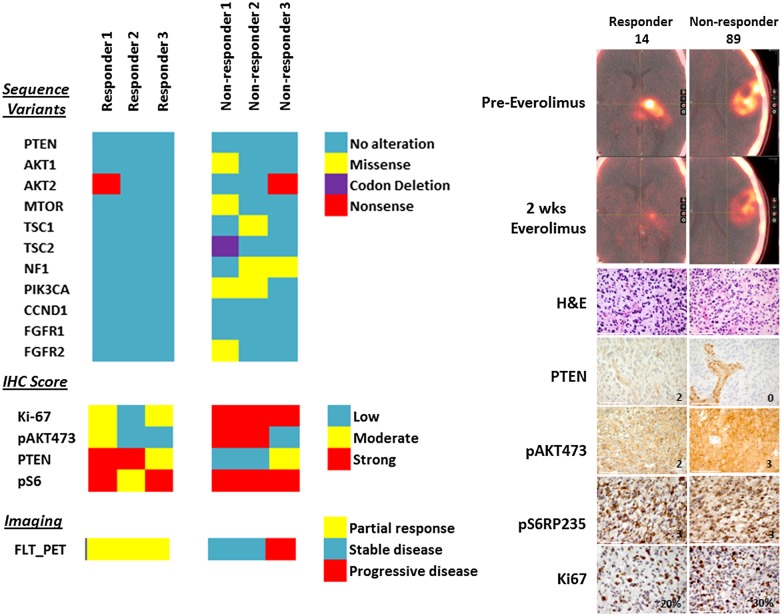
Fig. 5.
Heat map of sequencing (top left), IHC (middle left), and 18FLT-PET (bottom left) results for the 6 patients with PET and sequencing data. Top right panel demonstrates representative images from an 18FLT-PET responder (ΔSUVmax = −42%) vs nonresponder (ΔSUVmax = −14%). Bottom right panels demonstrate hematoxylin and eosin (H&E), PTEN, pAkt, pS6, and Ki67 staining for the 2 representative patients. Scale bar = 100 µm. CCND1, cyclin D1; FGFR, fibroblast growth factor receptor.

