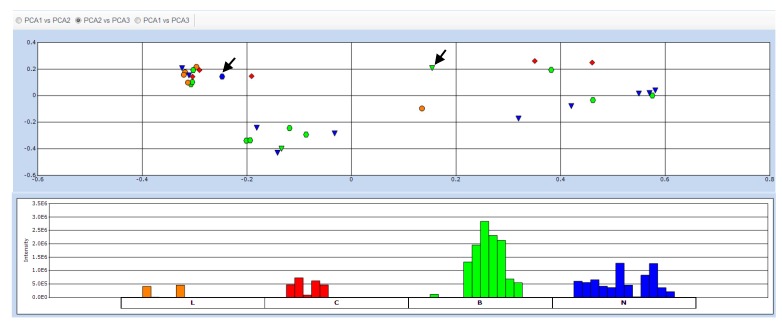
Figure 2.
Principal Component Analysis (PCA) of all extracts. The extracts were colored according to their anti-inflammatory activities: Green hexagon (B) for the extracts able to inhibit both enzymes (COX and LOX), orange circle for those able to inhibit only LOX (L), red square for those inhibiting only COX (C),and blue triangle for those found to be inactive (N) against both enzymes. Two reference samples for negative (blue hexagon) and positive (green triangle) activity were indicated by arrows. The trend bar graph indicated the occurrence of a single metabolite in each of the studied extracts.

