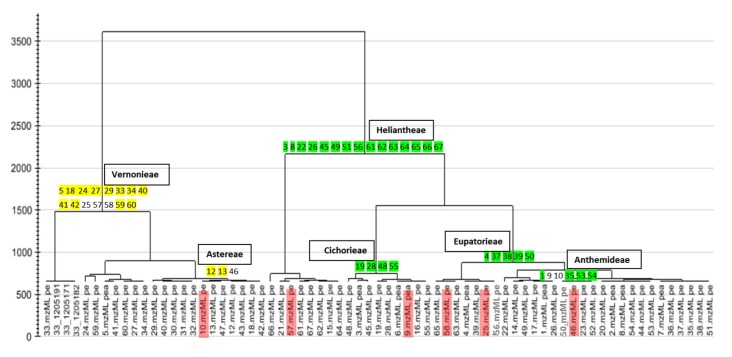
Figure 3.
Hierarchical Cluster Analysis (HCA) dendrogram for Asteraceae plant extracts analyzed in this study (n = 66, included root, stem and flower parts for some species). Highlighted (green and yellow) numbers represent sample codes of species-related extracts that clustered together in the PCA according to their similarity in the chemistry of their metabolomes. Red highlighted sample codes represent extracts with unique chemistry when compared with other extracts within their respective taxa.

