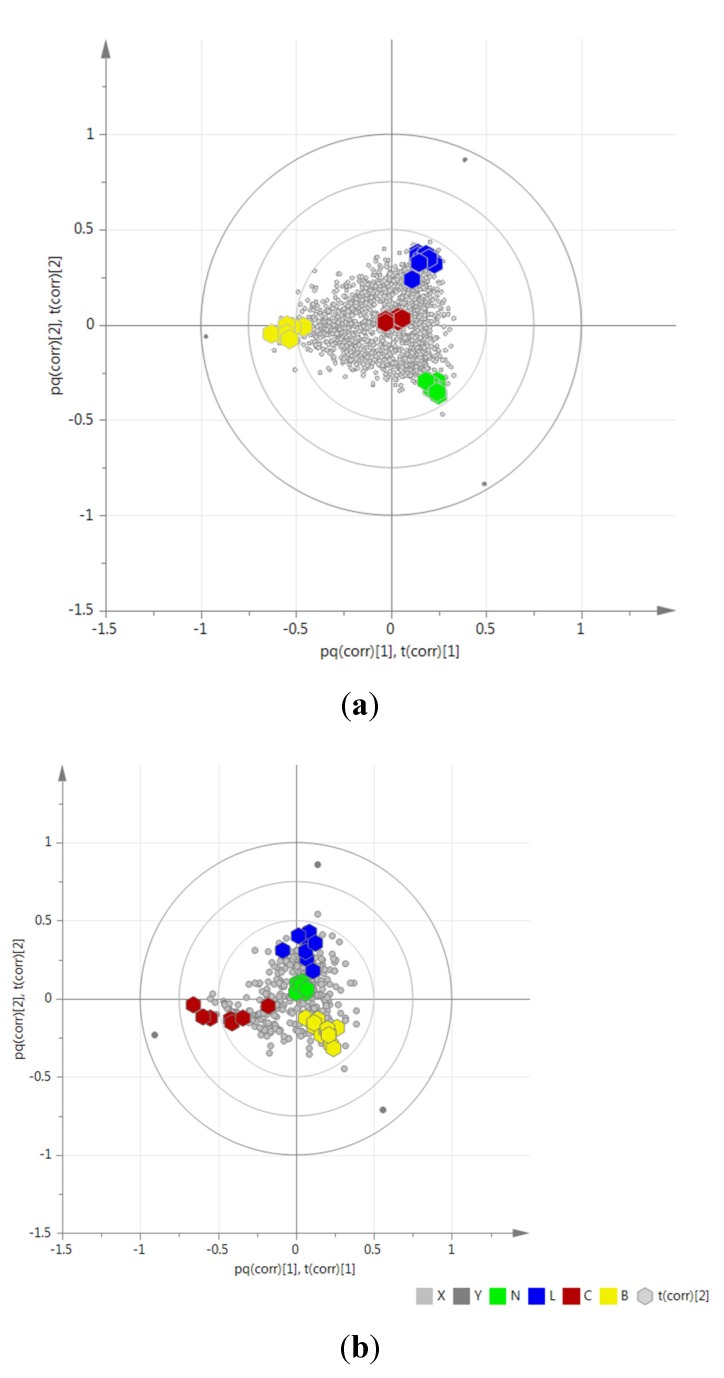
Figure 5.
(a) Negative mode; (b) Positive mode. O2PLS-DA biplots indicating the distribution of the extracts and their metabolome (X-variables) according to their AI property (Y variables).The sample codes were colored as follows: Dual inhibition = yellow (B); only COX-1 inhibition = red (C); only 5-LOX inhibition = blue (L); and no inhibition = green (N). Sample codes are found in Table 1 and Table S1.

