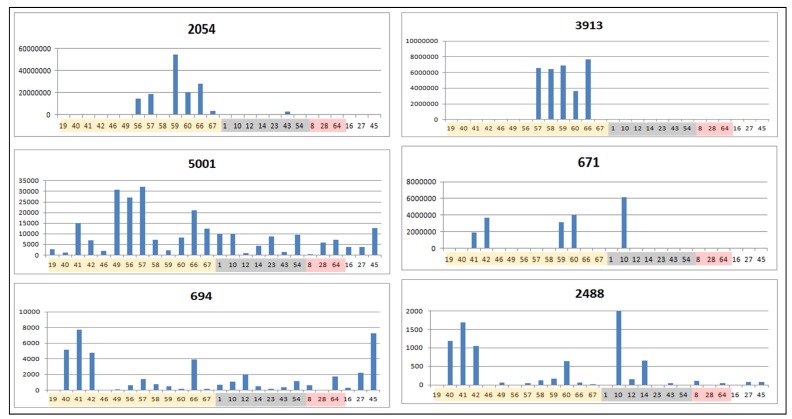
Figure 9.
Trend bar graphs indicating the peak areas of some of the biomarkers of dual inhibition of COX-1 and 5-LOX (negative mode HPLC-ESI-HRMS). The graphs are arranged in the order of decreasing correlation values. Extracts were colored as follows: Yellow for dual inhibitors, white for COX-1, grey for non-inhibitors, and pink for 5-LOX inhibitors (Table 1).p < 0.05 in t-test when comparing the peak area of the biomarkers in the active samples with those from non-dual inhibitors.

