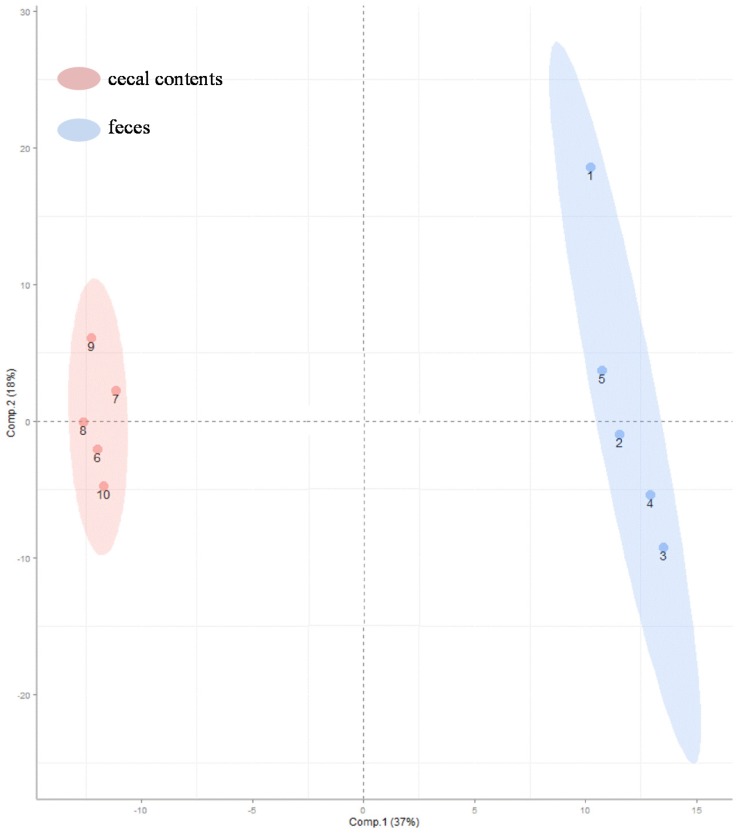
Figure 3.
Orthogonal signal correction partial least squares discriminant analysis (O-PLS-DA) was used to generate a multivariate classification model showing the relationship of the variance (in metabolites) and sample types (colonic-cecal content and feces). X and Y axis are O-PLS-DA sample scores for the first two latent variables. Color codes: pink, colonic-cecal contents; blue, feces.

