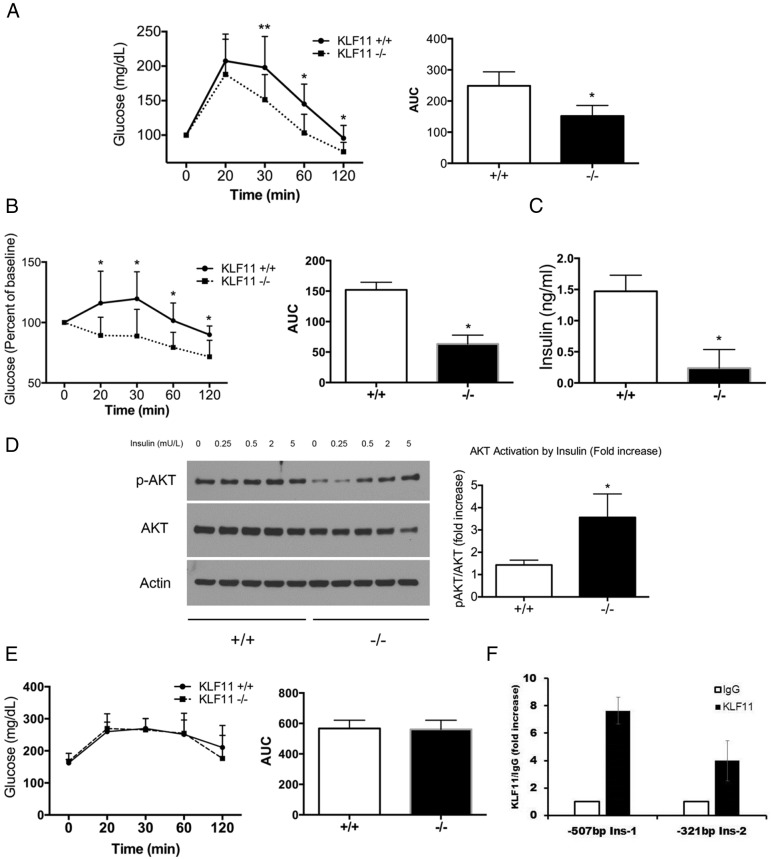
Figure 5.
Klf11−/− mice that are protected against obesity preserve glucose and insulin tolerance. GTT (A) and ITT (B) in female Klf11+/+ and KLF11−/− mice fed with HFD. Tests were performed with 10 mice per group. Graphs indicate AUC (*, P < .05; **, P < .1, t test) insulin levels (C) in Klf11+/+ and KLF11−/− animals fed a HFD. Response of liver slices to insulin as measured by AKT activation (D). Western blotting shows phosphorylated AKT upon exposure of liver sections to various amounts of insulin as indicated. Total AKT and β-actin are shown as loading controls. The graph on the right indicates density of phosphorylated AKT bands relative to total AKT levels at an insulin concentration of 0.5 mU/mL (*, P < .05, t test n = 3). PTT (E) in Klf11+/+ and KLF11−/− mice fed with HFD. Tests were performed with 10 mice per group. Graph indicates AUC. Chromatin immunoprecipitation indicates the presence of endogenous KLF11 on both the Ins-1 and Ins-2 gene promoters in murine MIN6 cells (F).

