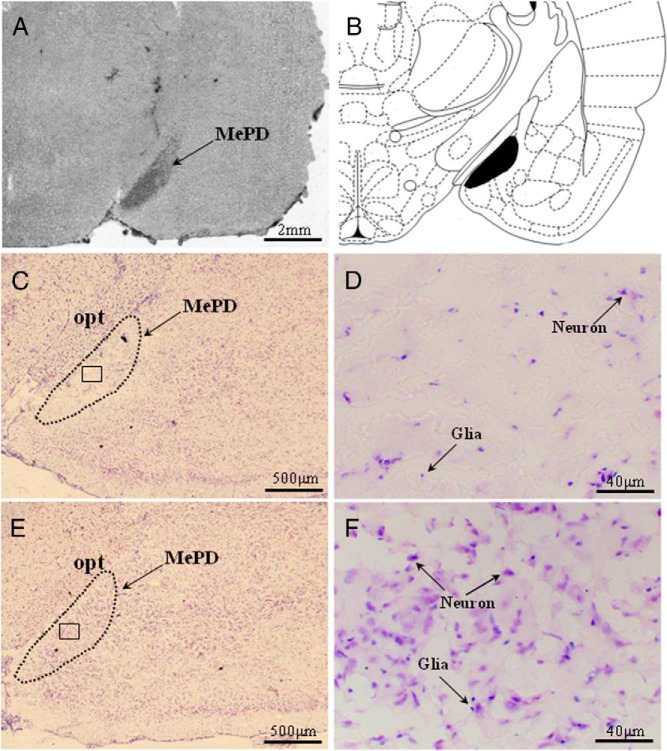
Figure 1.
Coronal sections through the rat brain at the level of the MePD showing its spatial relationship with the surrounding nuclei and ibotenate lesion resulting in specific neuronal cell loss. A, Section without staining showing the lesion area localized to the MePD. B, Schematic representation of site of lesion in the MePD (black filled) adapted from the rat brain atlas (39). C, Representative example of a coronal brain section stained with cresyl violet illustrating substantial neuron loss in the MePD after ibotenic acid lesioning. The dotted line indicates the approximate border of MePD. E, Representative photomicrograph from a MePD sham-lesioned rat. D and F, Magnified images of the areas enclosed by the squares in panels C and E, respectively, and illustrating the significant neuron loss to the MePD (D). opt, optic track.

