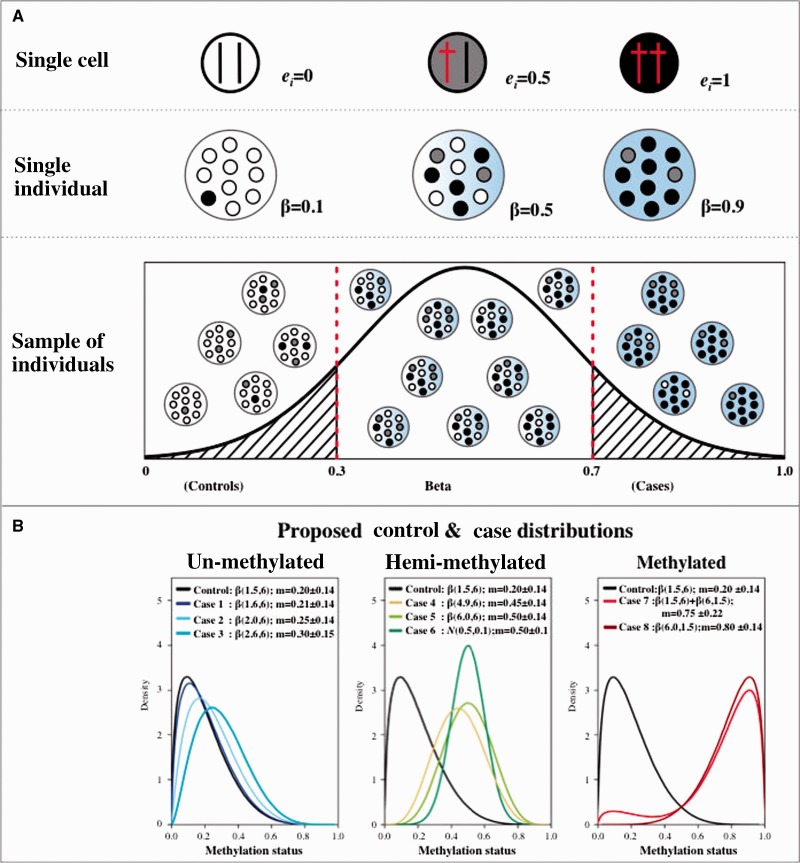
Figure 1.
DNA methylation patterns at the (A) cellular and individual levels, and (B) with respect to the proposed methylation distributions in the simulations. We assume that a cell can have two methylated alleles (ei = 1), one methylated allele (ei = 0.5) or two unmethylated alleles (ei = 0), and one sample from an individual contains different frequencies of these cells (A, upper panel). The methylated allele is shown as a dagger symbol, and the colour of each cell represents its methylation status: un-methylated (white), hemi-methylated (grey) and methylated (black) (A, upper panel). The methylation in each sample is represented as the summary of the methylated epi-allele, denoted here as beta (A, middle panel) which can range from 0 to 1 (A, lower panel). We assume that cases have greater mean methylation levels compared with controls, and we propose one control and eight case distributions. (B) Each line represents the density of methylation levels on each proposed distribution, where the Control distribution is un-methylated, Cases 1–3 represent predominantly un-methylated samples (left panel), Cases 4–6 are hemi-methylated (middle panel) and Cases 7–8 are predominantly methylated (right panel).

