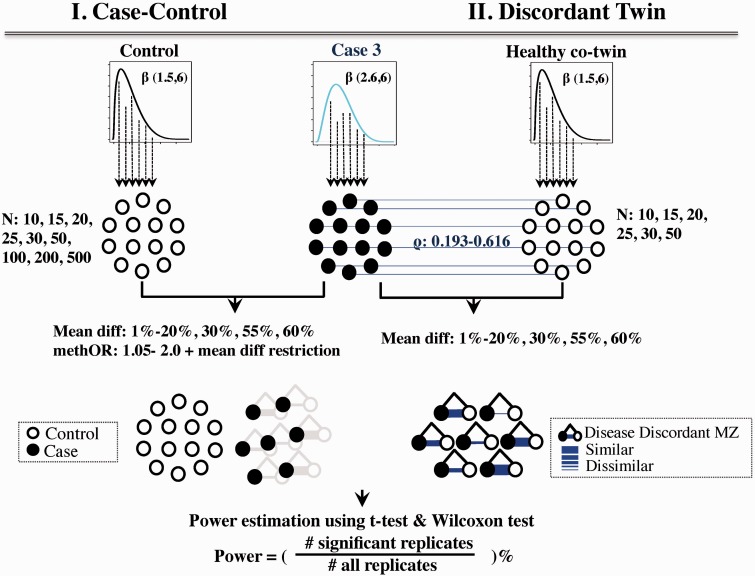
Figure 2.
Example of a permutation procedure. Cases were drawn from the case distribution and matched controls, and healthy co-twins were drawn from the control distribution. Only permutations with a set effect size between the two groups were used in the power calculation. The cases are identical for both case-control and twin designs (black dots). Controls in the case-control design were randomly selected from the control distribution. In the twin design, DNA methylation profiles in healthy co-twin controls were correlated with cases (Spearman’s correlation coefficients between 0.193 and 0.616). The thickness of the blue line in the twin design illustrates the similarity in DNA methylation between twins.

