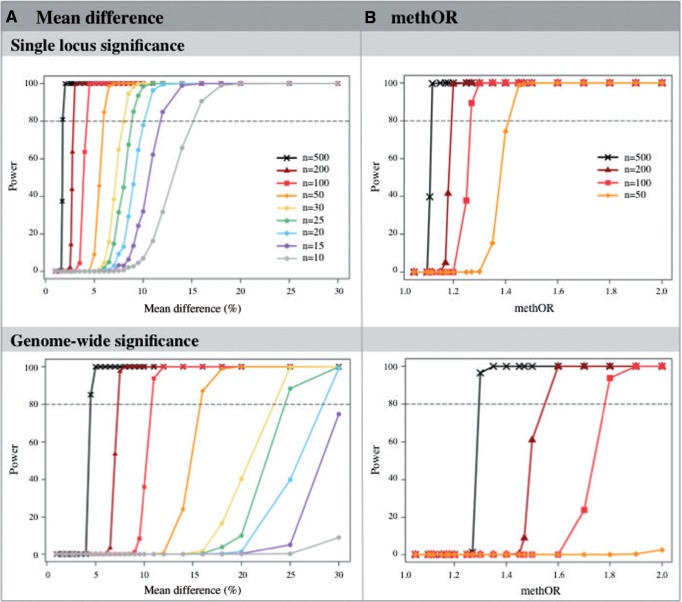
Figure 3.
Power of case-control EWAS. Estimates are obtained for a range of sample sizes, using (A) mean difference and (B) methOR effects, at nominal (upper panel) and genome-wide (lower panel) significance thresholds. Each line represents the power curve under different case-control sample sizes from 10 to 500 pairs of cases and controls.

