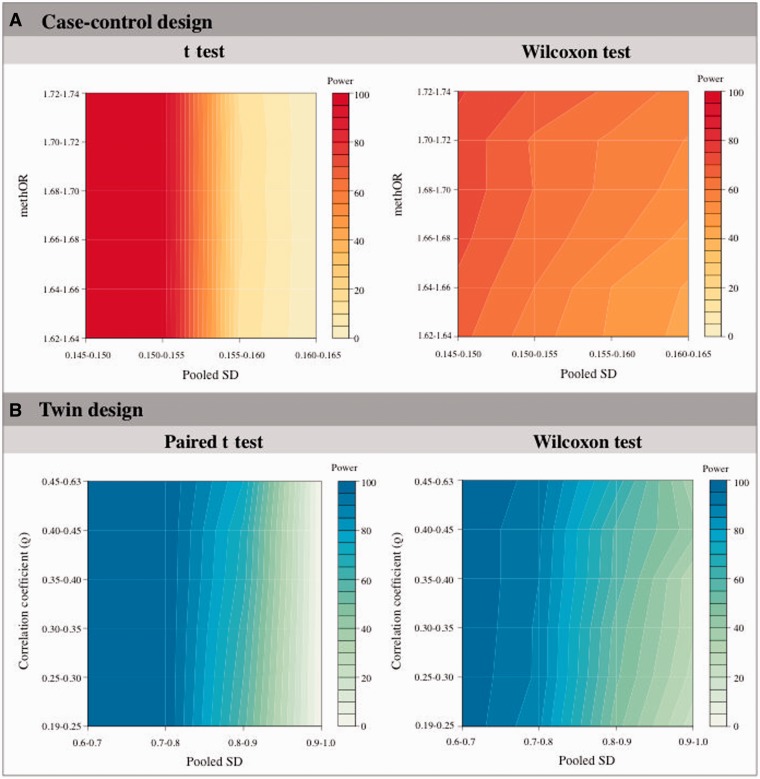
Figure 5.
DNA methylation variance and correlation can impact EWAS power. Case-control power estimates (A, upper panel) are shown under different pooled SDs and methORs at a fixed mean difference = 10% using parametric (left panel) and nonparametric (right panel) test statistics. MZ twin power estimates (B, lower panel) are shown under different pooled SDs and correlation coefficients at a fixed mean difference = 9% using parametric (left panel) and nonparametric (right panel) test statistics.

