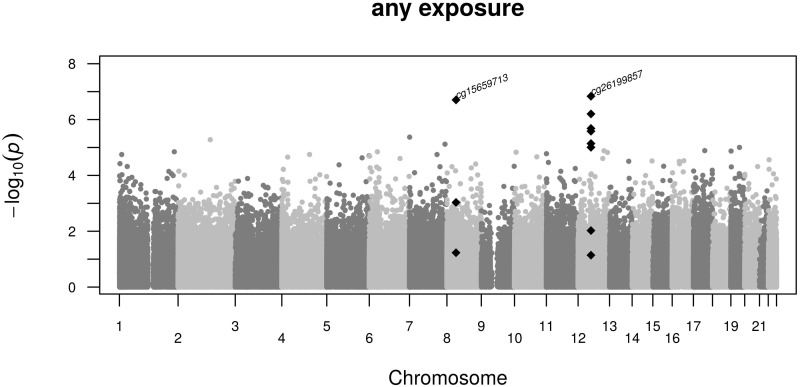
Figure 4.
Manhattan plot of specific CpG associations with any prenatal famine exposure. Shown are the –log10 P-values (y-axis) of the association between DNA methylation at single CpG dinucleotides and famine exposure along the autosomal chromosomes (x-axis). Marked by the CpG dinucleotide identifier are the CpG dinucleotides significant after multiple testing. These and adjacent nominally significant CpG dinucleotides are depicted as black diamonds.

