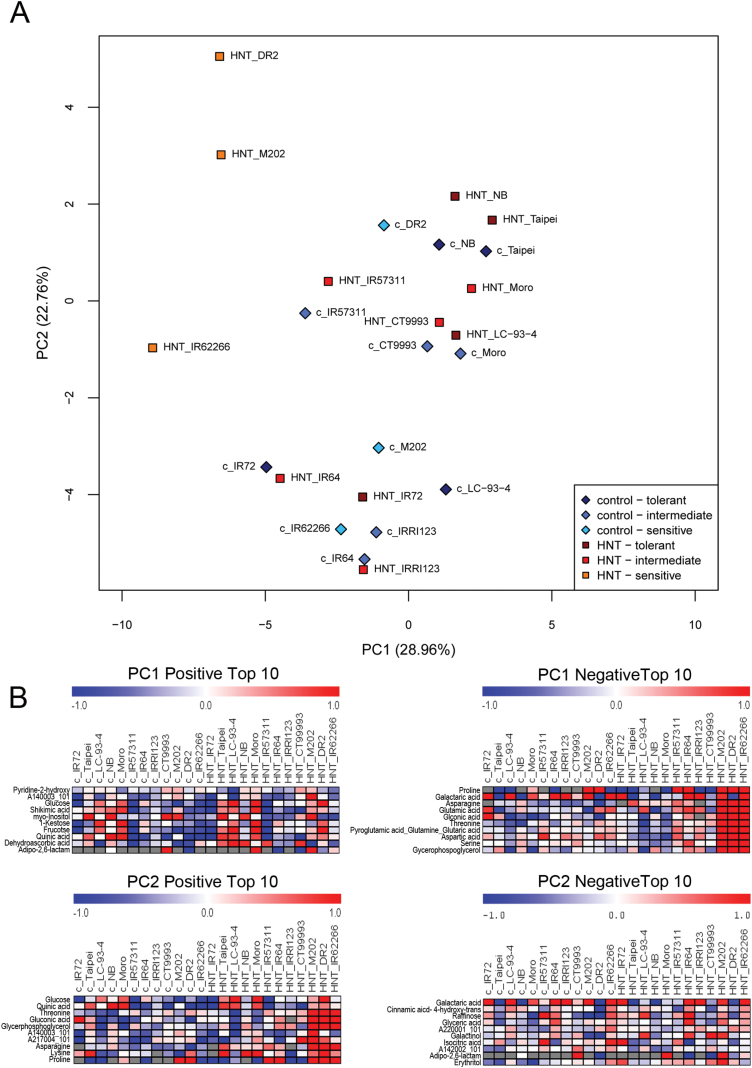
Fig. 1.
(A) Principal component analysis (PCA) of GC-MS metabolite profiles of leaves from 12 rice cultivars 48 DAS under control conditions (blue, ◊) or after 23 d (48 DAS) of HNT treatment (red, □). Tolerance groups are colour-coded (dark to light) as indicated in the figure. Scores of principal components PC1 and PC2 are shown together with the percentage of the total variance explained. (B) Metabolites with the top ten most positive and negative loadings from PC1 and PC2 are shown in panel. Metabolites with high intensities compared to the median are coloured in red, metabolites with low intensities in blue. Gray indicates a missing value.

