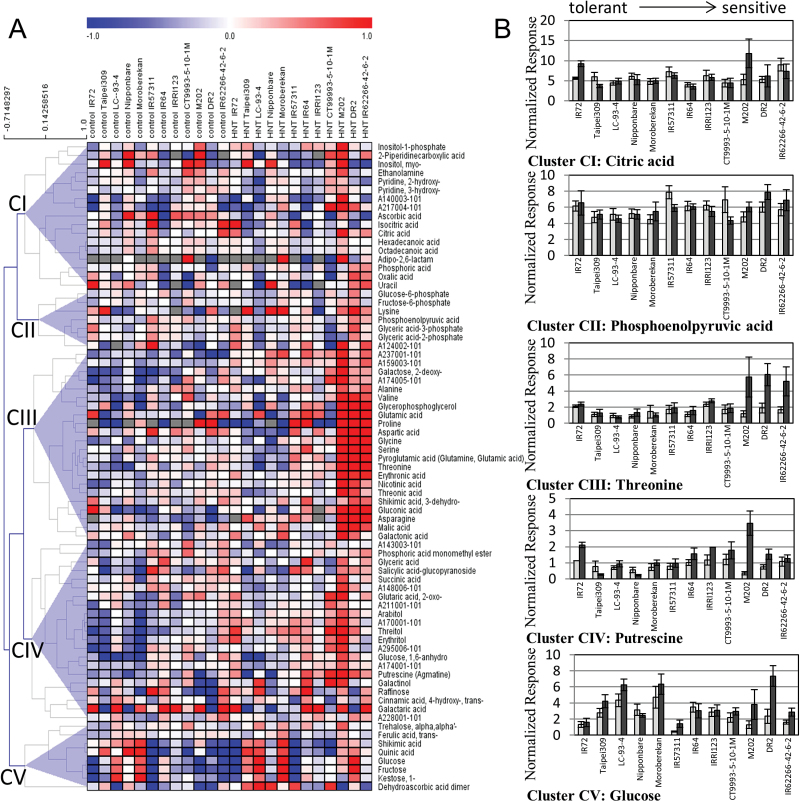
Fig. 2.
(A) Hierarchical cluster analysis (HCA) with Pearson correlation on 75 metabolites measured by GC-MS 48 DAS under control (left) and 23 d (48 DAS) of HNT (right) conditions in 12 rice cultivars indicated at the top of the figure. Metabolites with high intensities compared to the median are coloured in red, metabolites with low intensities in blue. Gray indicates a missing value. Cultivars are sorted from tolerant to sensitive (left to right). All metabolite data can be found in Supplementary Table S2. (B) Normalized responses of selected metabolites representing the clusters CI−V are shown in panel.

