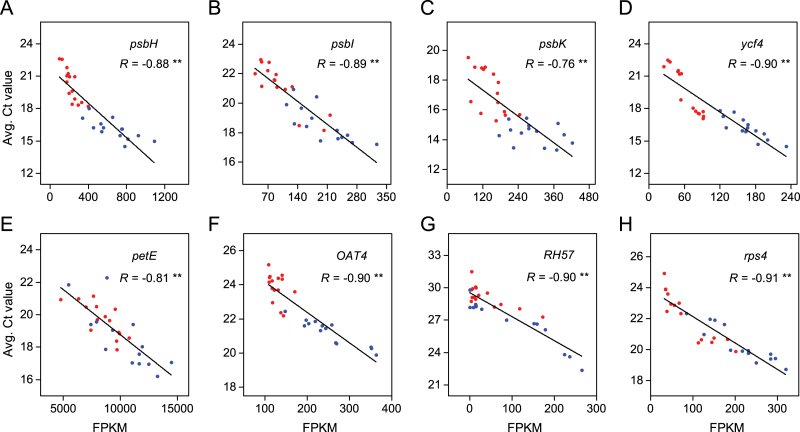
Fig. 5.
Expression level correlation between RNA-Seq and qPCR. Negative correlation between FPKM values of RNA-Seq and average Ct values of qPCR indicate a consistent estimation of the relative expression levels between the two methods. The graphs (A)–(H) represent the genes: MluLR17108 (psbH), MluLR17433 (psbI), MluLR14810 (psbK), MluLR17106 (ycf4), MluLR17402 (petE), MluLR5294 (OAT4), MluLR4566 (RH57), MluLR17105 (rps4), respectively. The R in the graphs indicates the correlation coefficient. ** represents the significant level (P <0.01, Spearman’s rank correlation test). Sequences of PCR primers are given in Table 4. Red and blue dots represent individuals sampled from JH and QG, respectively.

