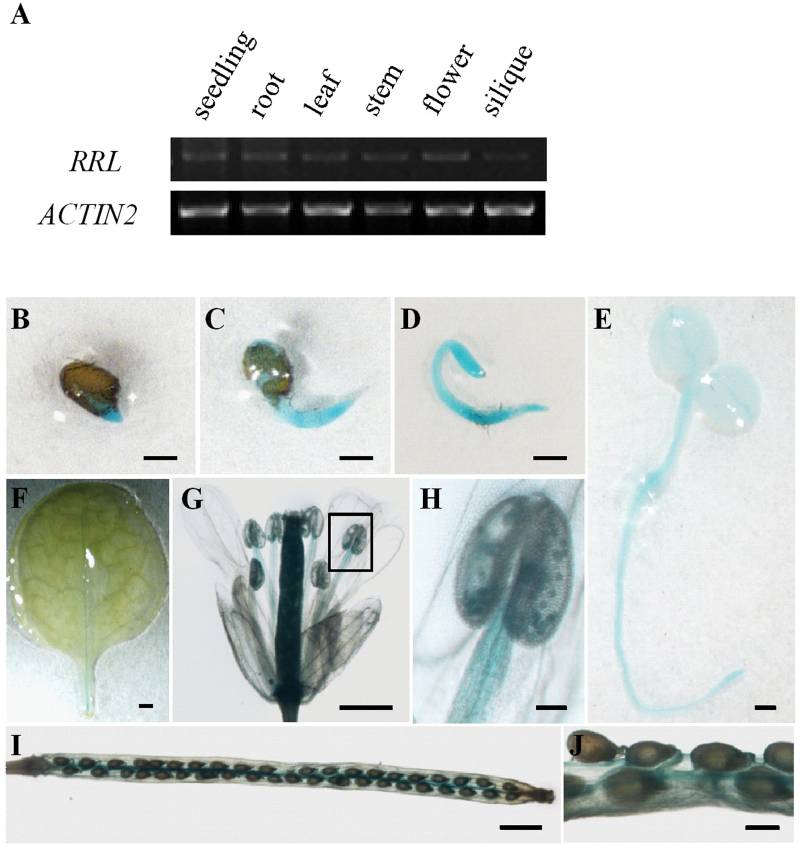
Fig. 4.
The expression pattern of RRL. (A) Semi-quantitative analysis of RRL gene expression in various tissues. ACTIN2 was used as a loading control. (B–J) RRL promoter-driven GUS expression in germinating seeds and developing seedlings (B–D), 4-day-old seedlings (E), rosette leaves (F), flowers (G, H), and siliques (I, J). Scale bars=0.1mm (B, C, D, E, J); 1mm (F, G, I). (H) Magnification of the areas outlined in (G). Scale bar=0.1mm (H). (This figure is available in colour at JXB online.)

