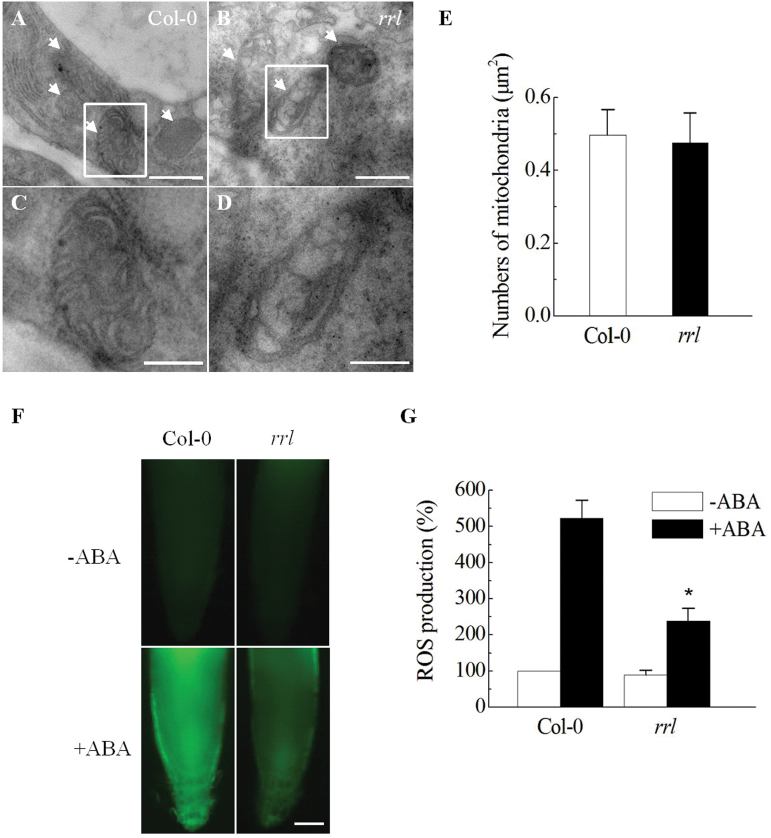
Fig. 5.
Structure and numbers of mitochondria and ABA-induced ROS production in the rrl mutant. (A–D) The mitochondrial structure in Col-0 (A) and the rrl mutant (B) was observed by transmission electron microscopy. (C, D) Magnification of the areas outlined in (A, B). Arrows indicate mitochondria. Scale bar=0.5 μm (A, B); 0.25 μm (C, D). (E) Numbers of mitochondria per square micrometre in 5-day-old seedlings of Col-0 and the rrl mutant were determined. Values are the means ±SD from three independent measurements. (F) ROS production was detected with the fluorescent dye DCF. Five-day-old seedlings were incubated with 2′,7′-dichlorodihydrofluorescein diacetate (H2DCFDA) for 30min. –ABA, ABA-free treatment; +ABA, 50 μM ABA treatment. Scale bar=20 μm. (G) Quantification of ROS levels in Col-0 and the rrl mutant before or after 50 μM ABA treatment. (n=30; ±SD; *P<0.001 compared with ABA-treated Col-0 plants). The fluorescent intensity in Col-0 with ABA treatment was taken as 100%.(This figure is available in colour at JXB online.)

