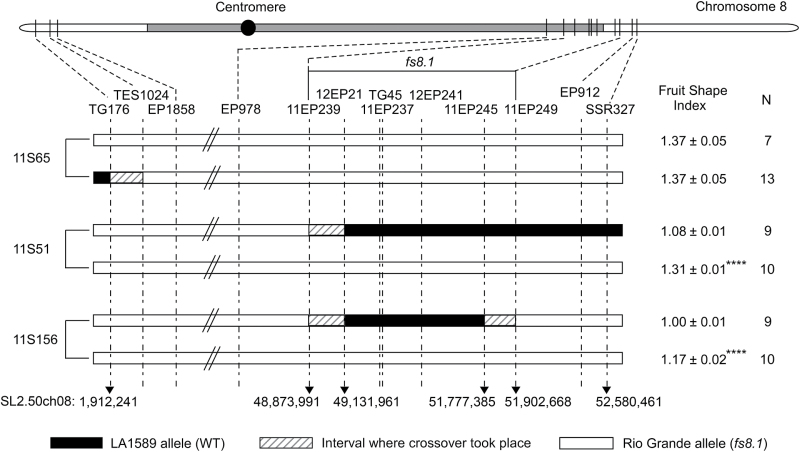
Fig. 2.
Fine-mapping of fs8.1 to a 3.03Mb region. Fruit shape index is the ratio of maximal length to maximal width, and eight fruits per plant in each genotype were evaluated; ****P<0.001 by Student’s t-test; N, plant number. The positions of the centromere (black dot) and pericentromeric heterochromatin (grey shading) are according to Shearer et al. (2014).

