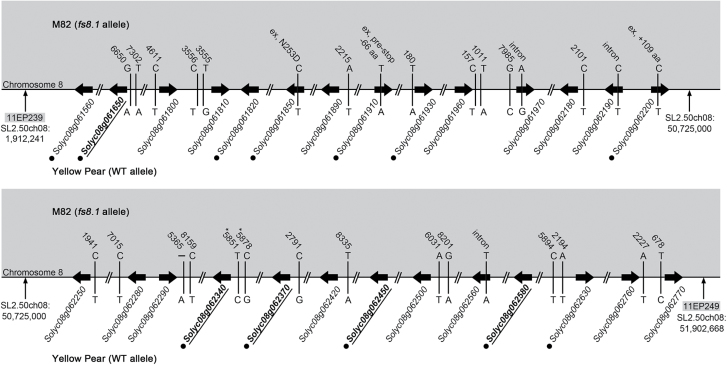
Fig. 4.
Genome sequence variations between M82 (fs8.1 allele) and Yellow Pear (WT allele) at the fs8.1 locus. Black arrows represent expressed genes. Vertical lines represent SNPs or small indels. The number above each SNP/small indel indicates the distance of the SNP/small indel from the nearest gene. Bold font with underlining indicates differentially expressed genes in anthesis-stage ovaries of fs8.1 backcrossed lines. Black dots indicate high likely candidate genes. –, deletion; ex, exon; *, the SNP was not confirmed in the additional datasets.

