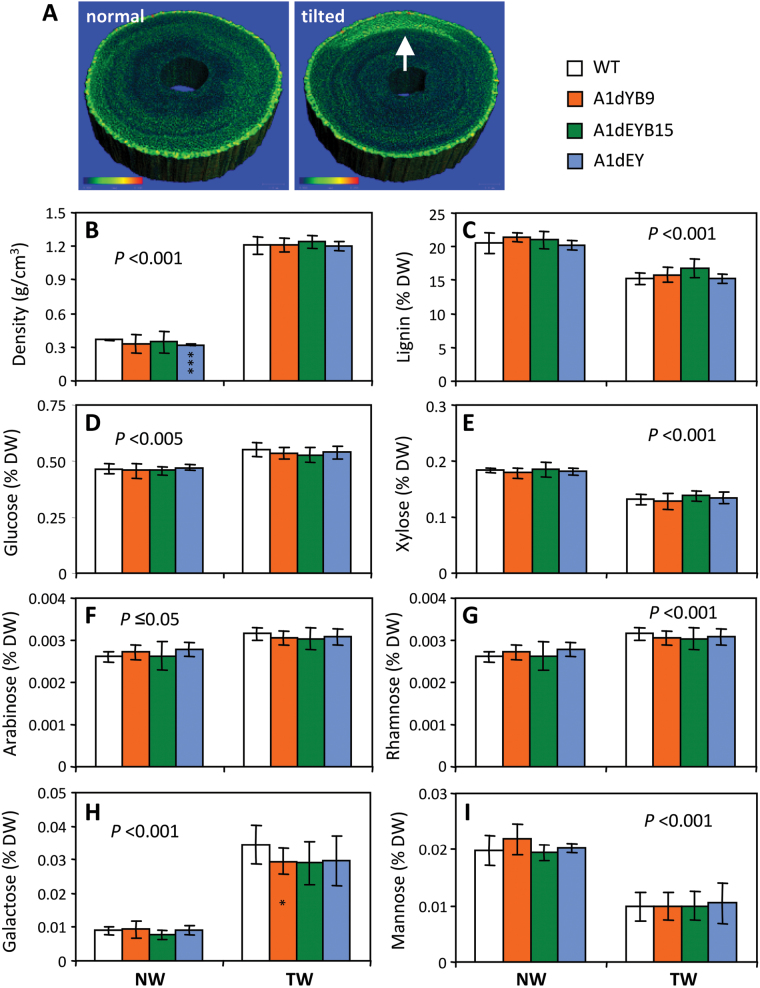
Fig. 4.
Characterization of tension wood. (A) Representative X-ray µCT images of normal and tilted stems. Bright pixels highlight the TW region (arrow) with increased cellulose deposition and wood density. (B) Wood density. (C) Lignin. (D-I) Structural carbohydrates including glucose (D), xylose (E), arabinose (F), rhamnose (G), galactose (H), and mannose (I). Error bars are SD of n = 4–10 plants. Statistical significance was determined using the two-sample t test. The P value in each panel denotes treatment effect (NW vs. TW) for all genotypes, while asterisks inside the bars indicate transgenic effect. ***P < 0.001; *P < 0.05.

