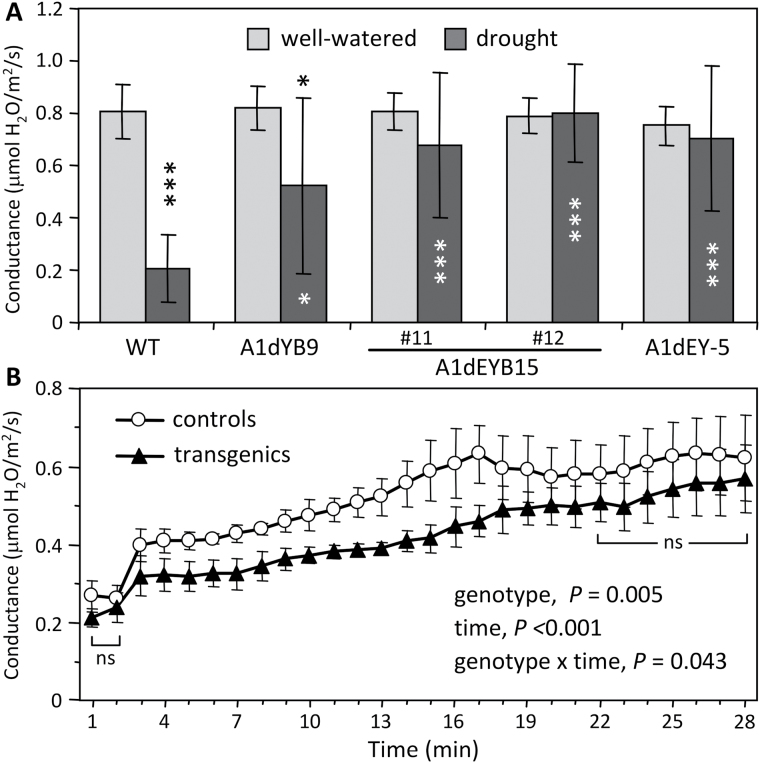
Fig. 6.
Stomatal responses of WT and transgenic leaves. (A) Stomatal conductance of mature leaves (LPI-15) under well-watered or drought conditions. Error bars are SD of n = 4–10 plants. Statistical significance of treatment effect was determined using the paired two-sample t-test (***P < 0.005; *P < 0.05). Asterisks above the bars are for treatment effects, and inside the bars are for transgenic effects. (B) Stomatal conductance of dark-acclimated mature leaves (LPI-10) in response to light. Error bars are SD of n = 5 control (WT and transgenic control) or transgenic (A1dYB9 and A1dEYB15) plants. Statistical significance was determined by repeated measures two-way ANOVA. ns, no significance based on the Student-Newman-Keuls post-hoc test.

