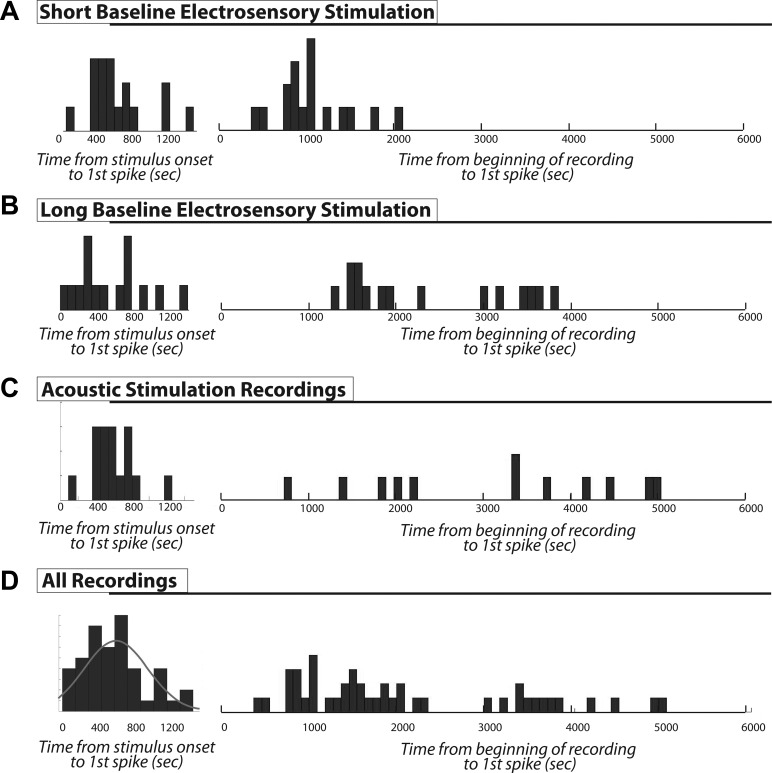
Fig. 2.
Response onset latency. Histograms display latency to the first spike generated from the extracellular recordings shown in Fig. 1. For each category, the distribution at left shows latency to first spike relative to the onset of stimulus presentation, and the distribution at right shows the latency to first spike relative to the beginning of recording (including any recorded prestimulus baseline). Bin widths are 90 s. A: short baseline electrosensory stimulation. The prestimulus baseline varied very little, and similar, though slightly time-shifted distributions are shown for both choices of the time point for latency measurements. B: long varied prestimulus baseline lengths. In this case the distributions based on the beginning of the recording become more flat and arbitrary. C: a similar result is shown with acoustic stimulation. D: histogram of pooled data from all recordings. The left histogram shows that the latency to first spike mostly occurs within 800 s and is loosely associated with the stimulus onset; the gray line is the Gaussian density fit to the histogram. The right histogram clearly shows that there is no preferred latency range to recording onset. The longer latencies (>3,000 s) in this histogram are the ones with long and variable prestimulus baselines. These cases make clear that these cells did not discharge spontaneously.

