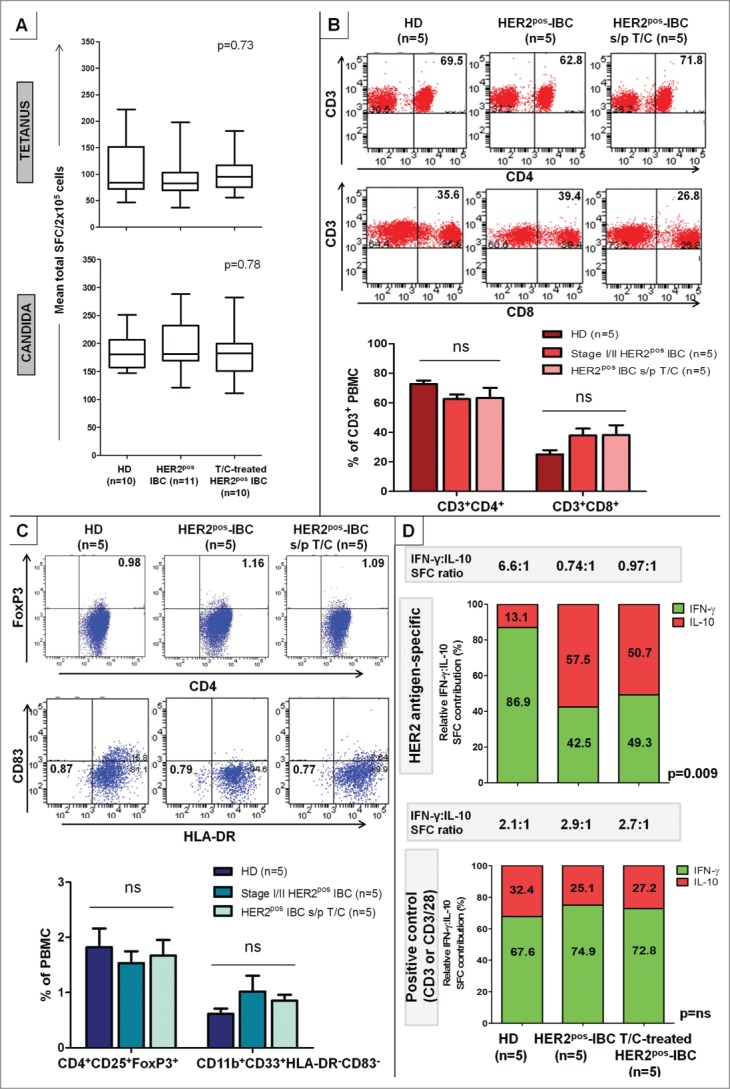
Figure 3.

Anti-HER2 Th1 deficit in HER2pos-IBC is not attributable to lack of immunocompetence or increase in immunosuppressive phenotypes, but associated with a functional shift in IFNγ:IL-10-producing phenotypes. PBMCs from HER2pos-IBC patients, both treatment-naive and T/C-treated, did not differ significantly from HDs in (A) IFNγ production to recall stimuli tetanus toxoid or Candida albicans by ELISPOT. Results presented as median ± interquartile range (IQR) IFNγ SFC per 2 × 10⁵ cells in box-and-whiskers plots; (B and C) Relative proportions of CD4+ (CD3+CD4+) (B top) or CD8+ (CD3+CD8+) T-cells (B bottom), Treg (CD4+CD25+FoxP3+) (C top) or MDSCs (CD11b+CD33+HLA-DR−CD83−) (C bottom) by flow cytometry. Representative stainings within groups are shown; results in adjoining histograms expressed as mean proportions (%) ± SEM as indicated. (D) Donor-matched cumulative IFNγ and IL-10 production (SFC per 106 cells) across six HER2 Class II peptides compared in HD, treatment-naive HER2pos-IBC, and T/C-treated HER2pos-IBC patients. Relative HER2-specific IFNγ to IL-10 proportions (% depicted in graph) decreased significantly from HDs [IFNγ/(IFNγ + IL-10) = 86.9%; IL-10/(IFNγ + IL-10) = 13.1%] to HER2pos-IBC patients with (49.3%; 50.7%) or without (42.5%; 57.5%) T/C treatment. Absolute IFNγ:IL-10 production ratio changed from 6.6:1 (HDs) to 0.97:1 (T/C-treated) and 0.74:1 (HER2pos-IBC), respectively (top panel). No significant relative shifts in IFNγ:IL-10 production were observed to positive controls (anti-CD3/anti-CD3/CD28) (bottom panel).
