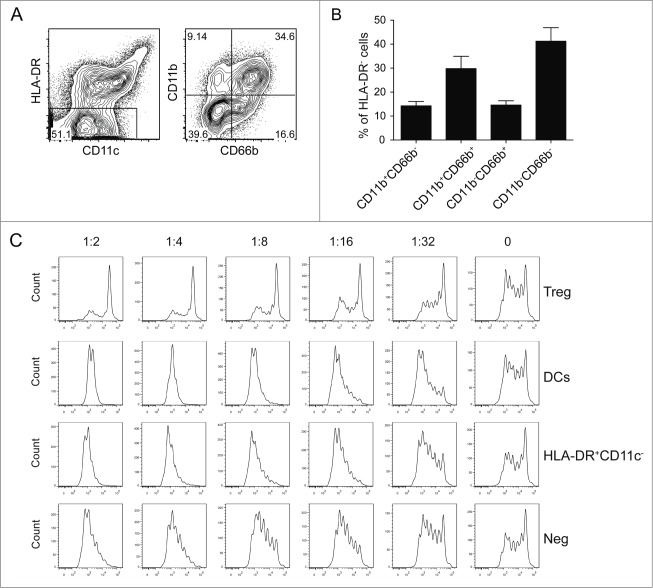
Figure 5.
HLA-DR negative population in the CBDC culture. (A–D) Characterization of HLA-DR−CD11c− population. (A) Gating strategy used for identifying different subsets. (B) Percentage of different subsets. (C) Suppression assay with cell trace violet labeled effector cells, activated by anti-CD3. Different amounts of sorted cell populations are added as indicated, Tregs were sorted as a positive control. After 4 d of co-culture, effector T cell proliferation is assessed by cell trace violet dilution as shown with FACS plots or (D) in a bar graph. Data represent at least three independent experiments.

