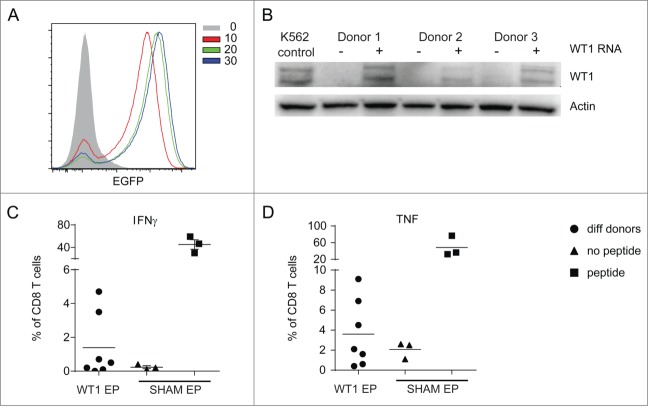
Figure 6.
CBDCs stimulate WT1-specific T cells. RNA-electroporation of CBDCs. (A) GFP expression 4 h after increasing doses of GFP-electroporation measured by FACS. (B) WT1 Western blot of three different donors 4 h after electroporation with WT1 or sham as a control. K562 cell-line was used as a positive control. (C, D) Cytokine production by WT1 specific T cell clone after 4 h co-culture with CBDCs of seven different donors (dots) after WT1 electroporation. Sham electroporated DCs with (squares) or without (triangles) WT1 peptide serve as controls. (C) IFNγ and (D) TNFα production. Data represent at least three independent experiments.

