
Fig. 1.
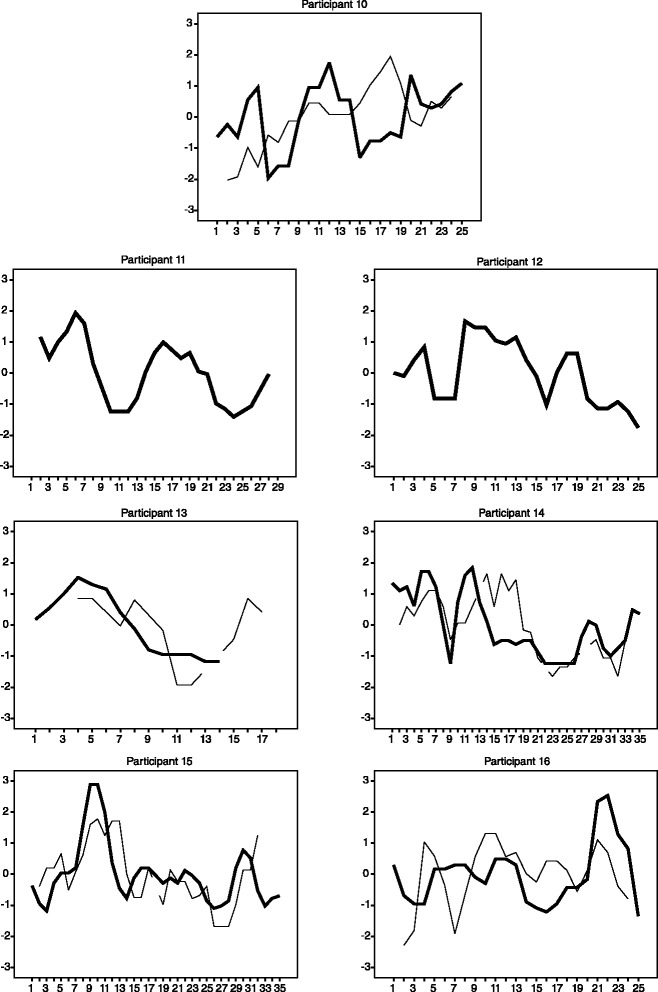
z-scored 3-day-smoothed serum IL-15 concentration (thin line) plotted against z-scored 3-day-smoothed daily self-reported fatigue (thick line), by participant. IL-15 concentration/fatigue severity are represented on the y-axis. Time is represented on the x-axis. IL-15 was selected for display as our statistical tests suggested that it was most significantly associated with fatigue severity fluctuations. Two participants did not express IL-15 at concentrations that were measurable