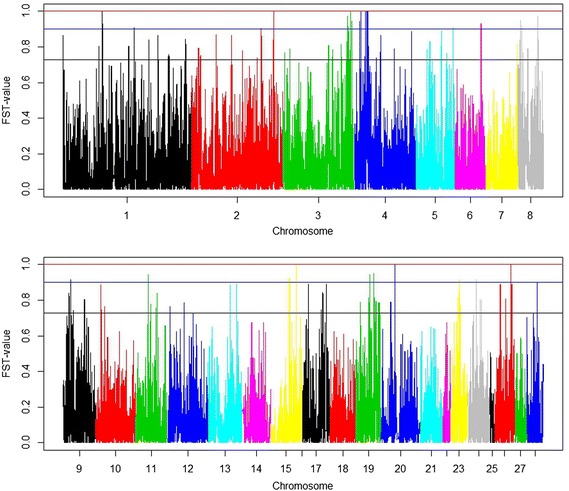
Fig. 2.

Manhattan plots of FST-indexes. The top panel shows the FST-values of each marker from chromosomes 1 to 8 and the bottom panel for chromosomes 9 to 28. The top threshold value indicates the genome-wide significance level pgenome wide <0.05; the middle and bottom threshold values are the nominal significance levels pnominal ≤5 × 10⁻⁵ and pnominal ≤5 × 10⁻⁴, respectively
