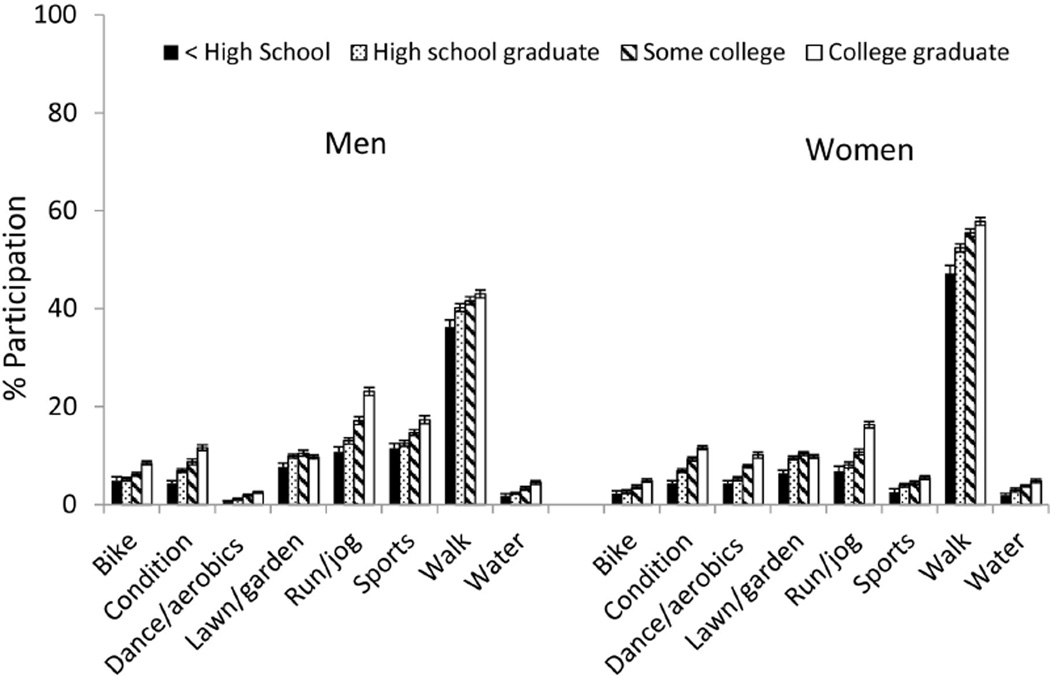
Figure 1.
Age-adjusted percentage (and 95% confidence intervals) of adults participating in specific activities by education level and sex—Behavioral Risk Factor Surveillance System, 2011. All linear trends are significant (P < 0.006); quadratic trends are significant (P < 0.006) for men’s bicycling, women’s running, and women’s lawn and garden. Note. All estimates and standard estimates are weighted according to BRFSS sampling methodology and age adjusted to the projected 2000 U.S. standard population using 5 age groups: 18–24, 25–34, 35–44, 45–64, and ≥ 65.

