
Fig. 2.
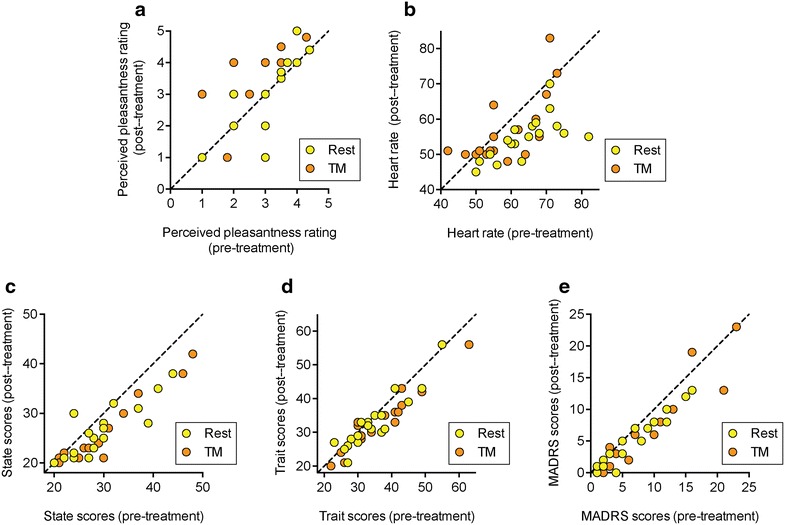
Effects of rest and TM upon a perceived pleasantness; b heart rate, c STAI-state; d STAI-trait and e MADRS scores of the subjects. The graphs show the individual data points, and the dotted lines are the 45° line of identity
Official websites use .gov
A
.gov website belongs to an official
government organization in the United States.
Secure .gov websites use HTTPS
A lock (
) or https:// means you've safely
connected to the .gov website. Share sensitive
information only on official, secure websites.
Effects of rest and TM upon a perceived pleasantness; b heart rate, c STAI-state; d STAI-trait and e MADRS scores of the subjects. The graphs show the individual data points, and the dotted lines are the 45° line of identity