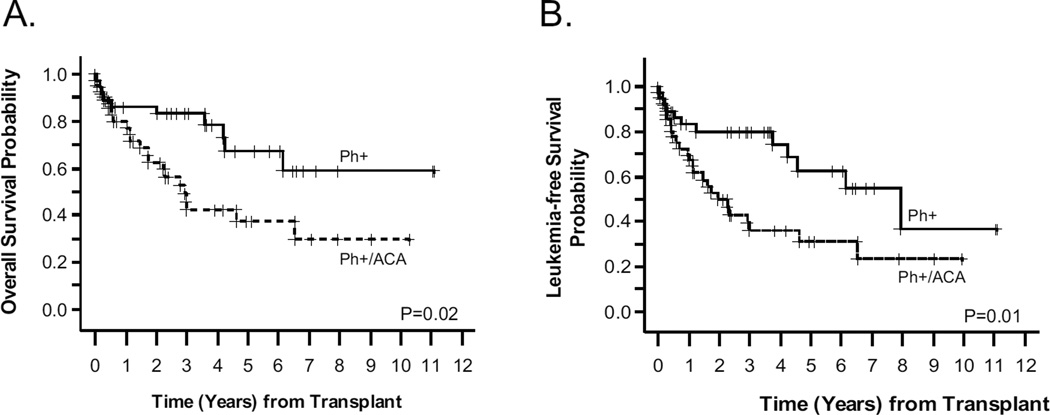
Figure 1. Survival outcomes stratified by presence/absence of ACA.
Panel A plots overall survival (OS) and Panel B plots leukemia-free survival (LFS) by Kaplan-Meier. Solid lines represent patients with isolated Ph+ (n=37), and dashed lines represent patients with Ph+ and additional cytogenetic abnormalities (ACA) (n=41).

