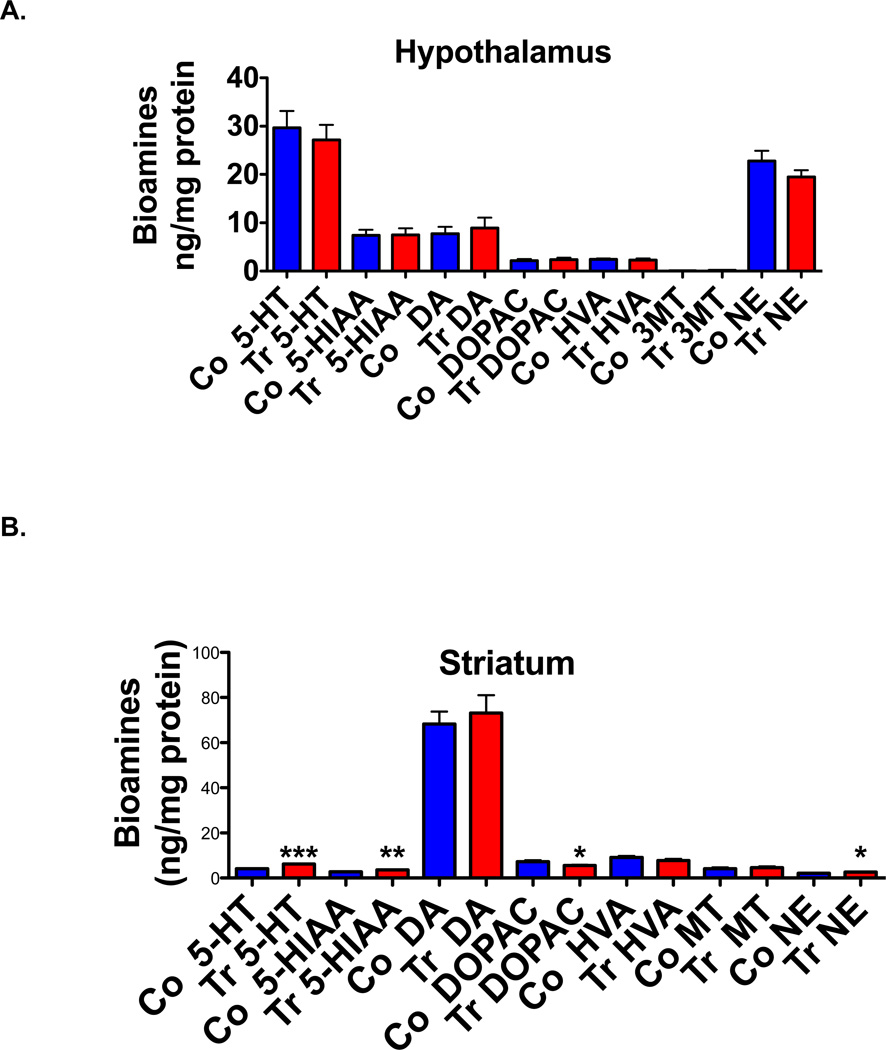
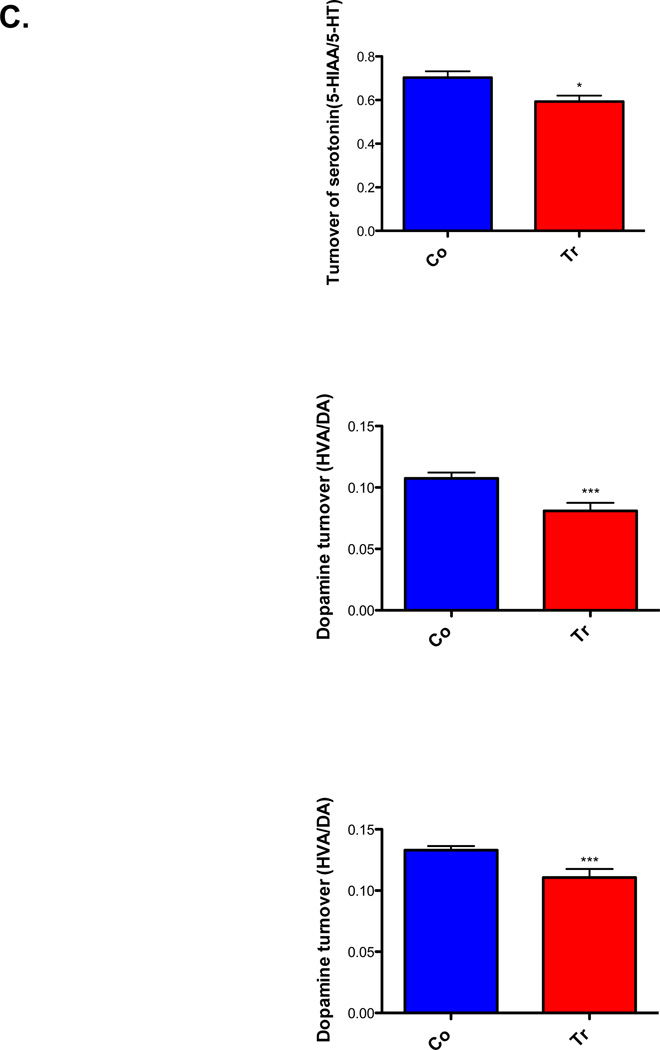
Fig. 4. Bioamine levels in whole hypothalamus.
The histogram represents mean ±SEM bioamine levels in ng/mg protein (n=8/genotype, (A) hypothalamus and (B) striatum tissues of control and ADAR2 transgenic mice, and (C) bioamine turnover in striatum of control and ADAR2 transgenic mice. *=p<0.01, **=p<0.001 and ***=p<0.0001.


