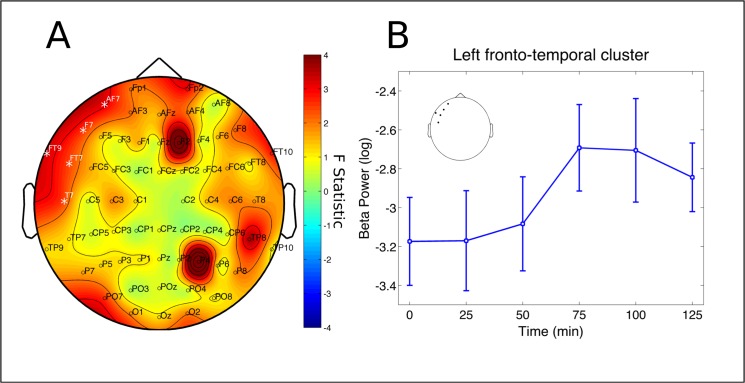
Fig 4. Beta rhythm cluster.
Changes in beta frequency band power spectrum over the 2 hours since ayahuasca ingestion. A) F statistics in the entire scalp revealed a significant cluster at left fronto-temporal electrodes (FT9, AF7, F7, FT7 and T7, p = 0.0260, highlighted by white *). B) Beta band increases did not survive post-hoc analysis. Inset highlights the electrodes averaged for the post-hoc analysis, in correspondence with A. Data in B is expressed as mean and standard error.

