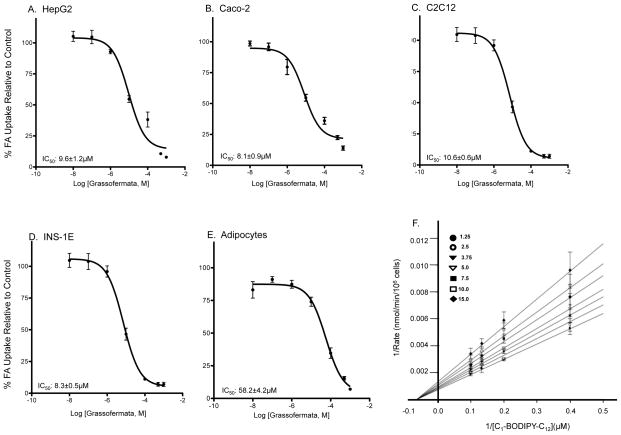
Fig. 1.
Inhibition of C1-BODIPY-C12 uptake inhibition by Grassofermata in different cell lines as indicated (A–E). Dose response curves were fit using dose-response non-linear regression model in Prism 5.0 software. Values are expressed as mean ± SE for 3 experiments assayed in triplicates. (F) Kinetic assessment of Grassofermata inhibition of C1-BODIPY-C12 uptake in HepG2 cells. The inserted legend indicates the concentrations in μM of Grassofermata used to generate the lines in the presence of 4 concentrations of C1-BODIPY-C12 (2.5–10 μM). Data points are the mean and the error bars indicate SD. Analysis was performed using SigmaPlot 12 enzyme kinetics module.

