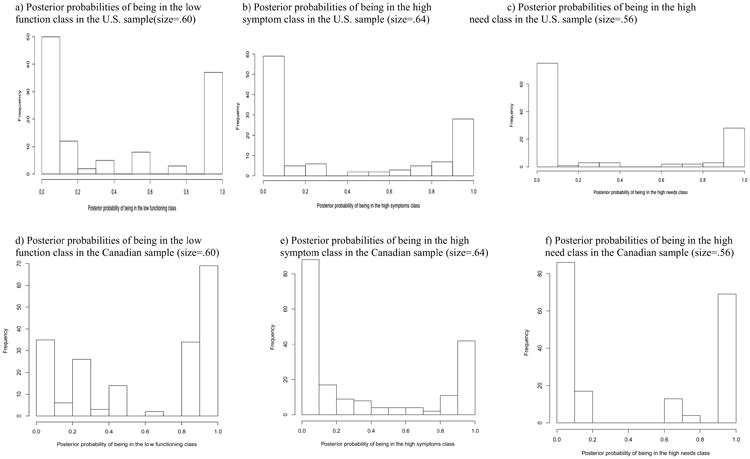
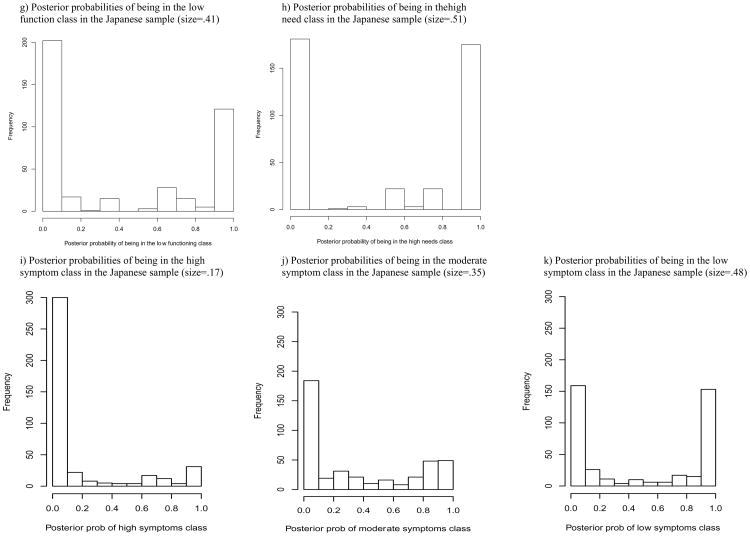
Fig. 2.

Histograms showing the distributions of model-based posterior probabilities of being assigned to the classes first for the U.S. sample (N=117; From Snyder, Garrett-Mayer, Blackford et al., 2009)[5], followed by the Canadian sample (N=189) and Japanese sample (N=407). Each value represents the probability that a particular individual is in that particular class, given his or her pattern of responses to the QLQ-C30 and SCNS items. Values close to 0 and 1 represent good classification, while values near 0.50 represent class assignment based on chance. Class size is presented as the proportion of the sample (out of 100).

