Fig. 2.

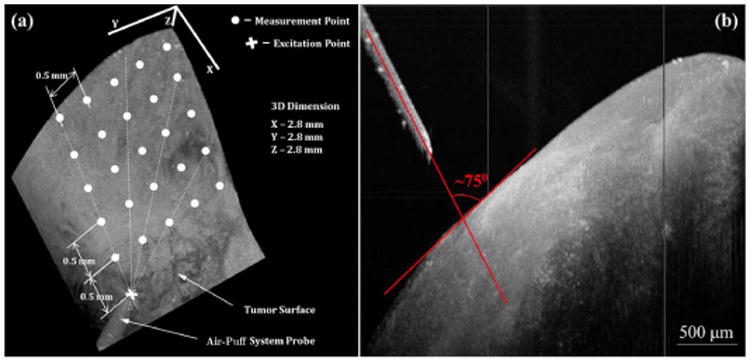
(Color online) (a) 3D OCT image of the tissue illustrating the locations of excitation and SWs measurement. (b) Side view of (a) showing excitation angle and distance between the air-puff port and tissue surface.

(Color online) (a) 3D OCT image of the tissue illustrating the locations of excitation and SWs measurement. (b) Side view of (a) showing excitation angle and distance between the air-puff port and tissue surface.