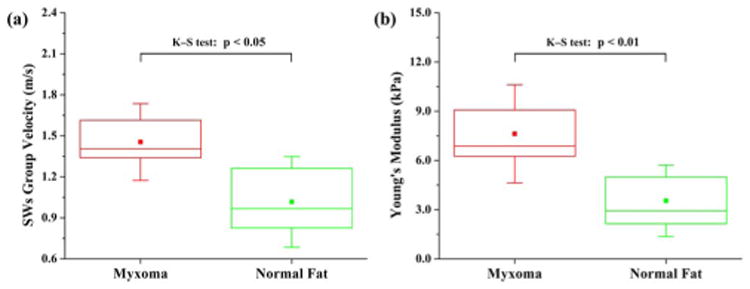
Fig. 4.

(Color online) Box plots of (a) the calculated group velocity of SWs and (b) the quantified Young's modulus for myxoma and normal fat; N = 13 and N = 12 for the measurements performed on myxoma and normal fat, respectively. The solid dots and whiskers represent the mean values and standard deviations of data, respectively.
