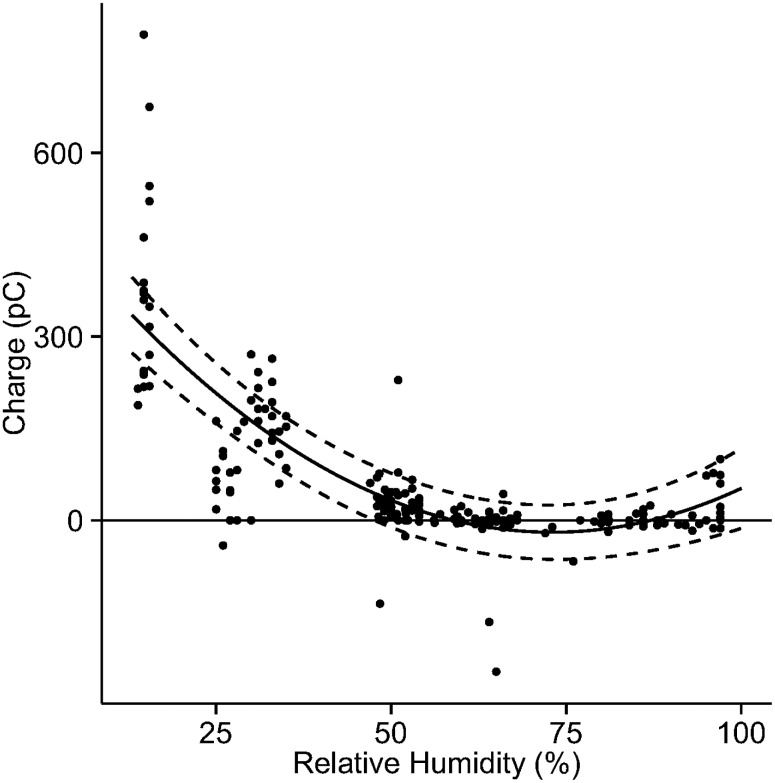
Fig 3. Hummingbird charge as a function of relative humidity; each point represents a single measurement.
The solid curve shows the best-fit quadratic curve: C = (505 ± 39) + (-14.4 ± 1.5) H + (0.098 ± 0.013) H 2, where C is charge in pC and H is relative humidity (%); parameter estimates for fixed effects are expressed as means ± 1 standard error. Dashed lines represent the 95% confidence band, taking into account uncertainty in both fixed and random effects.

